Monitor Files Health
Data consistency is crucial for data stored and accessed within the Tetra Data Platform (TDP). You can use the Files Health dashboard to ensure consistency between places where data is stored and accessed in the TDP. Data is currently stored in these locations:
- Data Lake (S3)
- System Properties (FileInfo) Service
- Search Indices (Elasticsearch)
- Athena
The Files Health Dashboard provides clear reporting and monitoring capabilities on the health of those data files in the TDP.
To access and view the Files Health Dashboard:
- Log in to TDP using an Administrator user account.
- In the Tetra Data Platform, click the Hamburger icon at the top left corner of the page to expand the TDP menu options (or hover over the list of icons to display the menu options).
- Select Health Monitoring from the list of menu options that appears on the left side of the page.
- From the Health Monitoring page, click the Files tab to view the Files Health Dashboard:
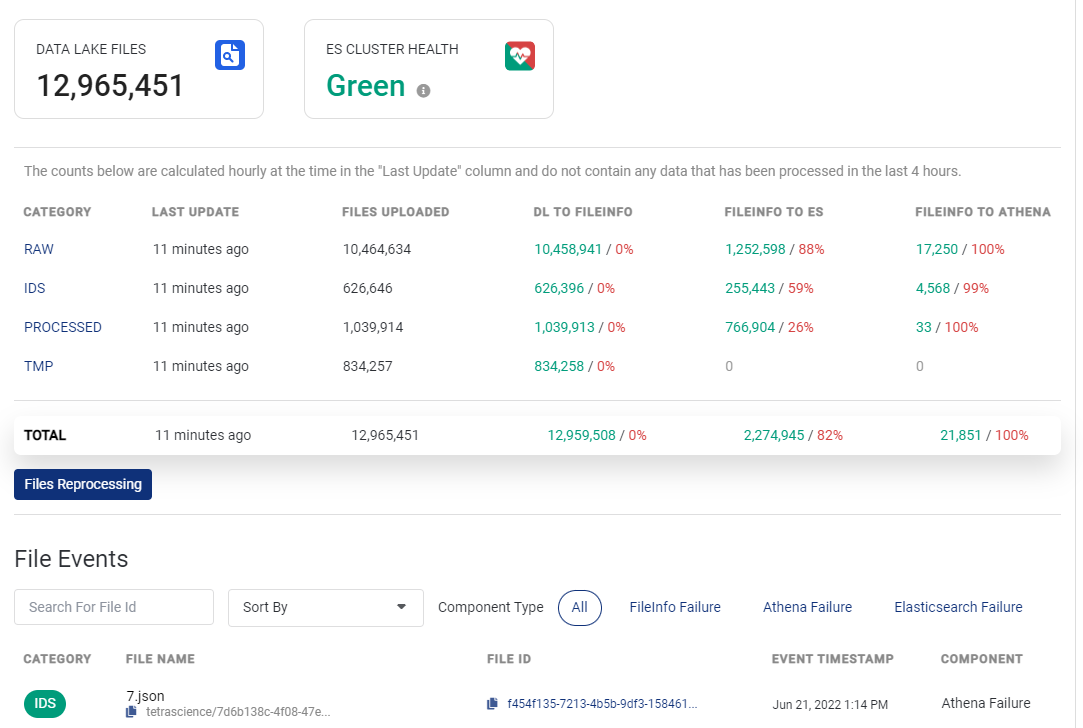
Files Health Dashboard
As an Administrator, you can quickly identify if any inconsistencies exist across the services. At the top of page, you can view:
- Total number of files in the Data Lake (S3) - The total number of files includes files in these categories: RAW, IDS, PROCESSED, and TMP (files or artifacts from a pipeline).
- Health status of the Elasticsearch (ES) cluster - State provided by AWS CloudWatch indicating cluster health:
- Green - Cluster is healthy, no action required
- Yellow - One or more of the replica shards on the ES cluster are not allocated to a node
- Red - At least one primary shard is not allocated to any node
Yellow or Red Status?
If the ES Cluster Health status is yellow or red, please contact your TetraScience Customer Success Manager (CSM) and/or your AWS IT team.
To review free and used storage space details for the ES cluster, hover over the information icon next to the status:
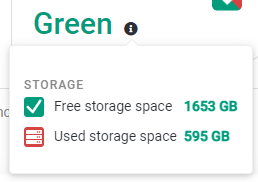
Hover to view storage space details for ES cluster
The amount of free storage space of the ES cluster determines the color:
- Green: Free storage space > 50%
- Yellow: 30% <= Free storage space <= 50%
- Red: Free storage space <= 30%
The middle of the page shows an overview of the number of files processed for each of the TDP services:
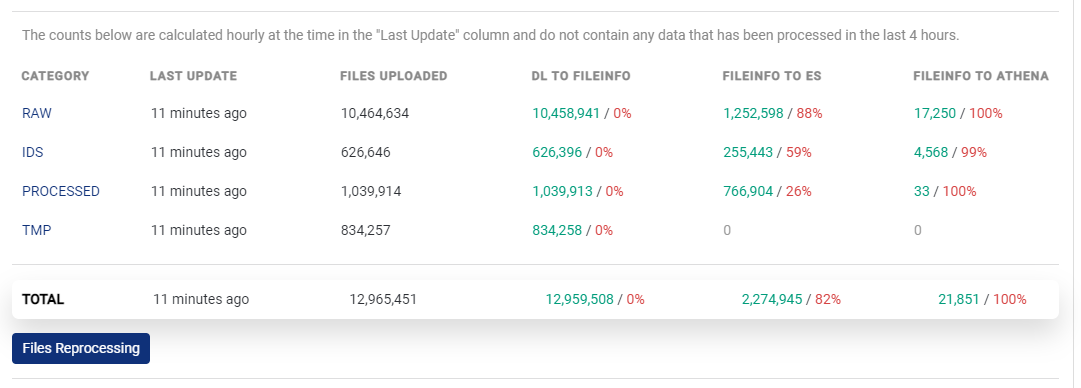
Processed Files across TDP Services
Data Displayed
Data in the overview table refreshes on a regular basis. For each category, the Last Update column indicates when the statistics were last calculated. Please note that the calculation of totals does not include any files processed in the last four hours.
The Processed File section includes:
- Category: Data Lake file categories: TOTAL, RAW, IDS, PROCESSED, and TMP (files or artifacts from a pipeline). By default, the TOTAL category is selected and its corresponding files display below.
- Last Update: Time/Date indicates when the statistics were last calculated.
- Files Uploaded: Number of files that were uploaded to the category. Only the latest version of a file (excluding those files marked for deletion) is uploaded.
- DL to FileInfo: Number of files uploaded from the Data Lake (S3) to the FileInfo Service (in green) and percentage of file discrepancies (in red).
- FileInfo to ES: Number of files uploaded from the FileInfo Service to ES Indices (in green) and percentage of file discrepancies (in red).
- FileInfo to Athena: Number of files uploaded from the FileInfo Service to Athena (in green) and percentage of file discrepancies (in red).
You can hover over the file results in the DL to FileInfo, FileInfo to ES, and FileInfo to Athena columns to view:
- Number of processed files (displays in green)
- Number of discrepancies (displays in red)
- Number of expected files
The criticality of any file inconsistency is indicated by color:
- Green - Indicates no error
- Orange - Indicates (1 <= x <=10) range of errors
- Red - Indicates > 10 errors
If any file discrepancies exist, you can click Files Reprocessing to perform a system file cleanup and return to a consistent data state. For more details about how to reprocess files, click here.
File Events Section includes:
The list of files that display show the latest failures (only):
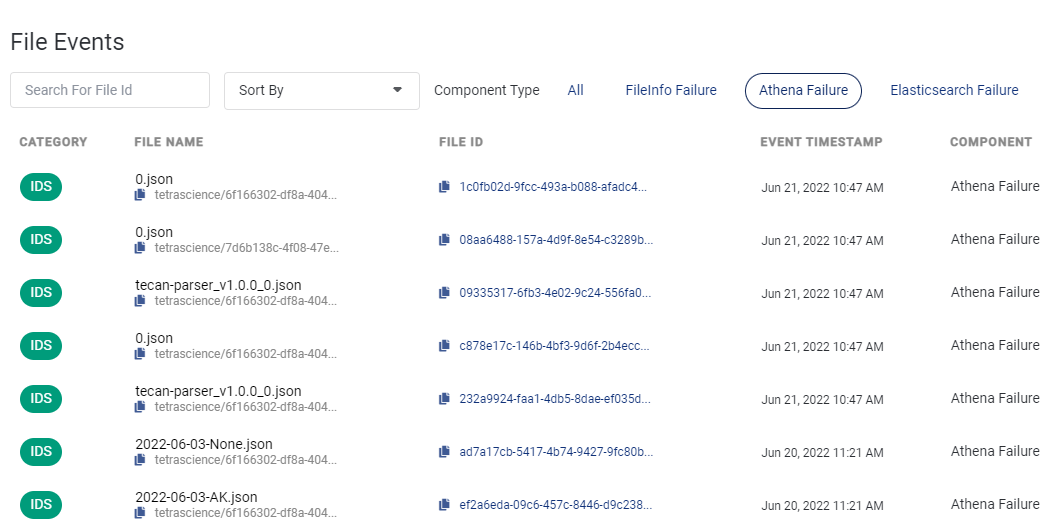
List of Files with Discrepancies
The Detailed List of Files section includes:
- Category: Data Lake file categories: RAW, IDS, and TMP (files or artifacts from a pipeline).
- File Name: Name of file. You can hover over the name to view its entire file path. To copy the file, click the copy file icon.
- File ID: Unique identifier of a file in TDP (primary key). You can hover over the ID to view it entirely. To copy the unique ID for the file, click the copy file icon.
- Event Timestamp: Date and time of when the failed event occurred.
- Component: Source of what caused the file to have discrepancies.
To organize and narrow the list of files to display, you can:
- Enter a Name or ID in the Search box to search the files
- Select to sort files by: Name A-Z, Name Z-A, Date New - Old, Date Old - New, or Category
- Set the amount of files to display at a time (25 files is the default)
- Narrow files to display based on component type, show: All, only FileInfo, only Athena, or only Elasticsearch failures.
To view the error details of a file, you can click a file in the list:
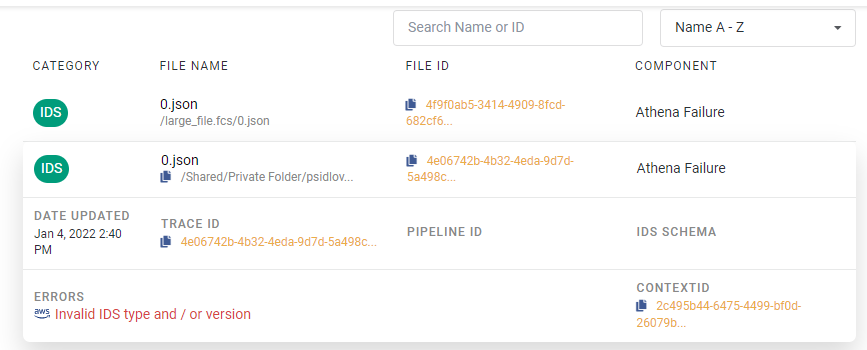
Selected File Showing Details
This table describes these additional file details:
| Field | Description |
|---|---|
| Date Updated | Date/Time when the error or failure occurred in the file. |
| Trace ID | If applicable, identifier that links related files together (foreign key). |
| Pipeline ID | If applicable, identifier for the pipeline used. |
| IDS Schema | If applicable, shows the name of the IDS Schema. |
| AWS link and Errors | Displays the error message and includes a link to query AWS CloudWatch based on the File ID. You can access CloudWatch to troubleshoot and refine your search using the ContextID. Access to the AWS CloudWatch link is based on your user privilege setting. |
| ContextID | An AWS CloudWatch specific ID you can use to navigate the logs to help locate the relevant section you want to refine. |
Updated over 1 year ago
