Monitor Data Hub Connectors Health
The Datahub(s) Connectors Health Dashboard provides statistical information on the health of your Data Hubs and their associated Connectors.
Access the Datahub(s) Connectors Health Dashboard
To view the Datahub(s) Connectors Health Dashboard, do the following:
- Sign in to the TDP as an admin user.
- Choose Health Monitoring. The Health Monitoring page appears.
- Choose the Data Hub(s) Connectors tab. The Data Hub(s) Connectors Health Dashboard appears.
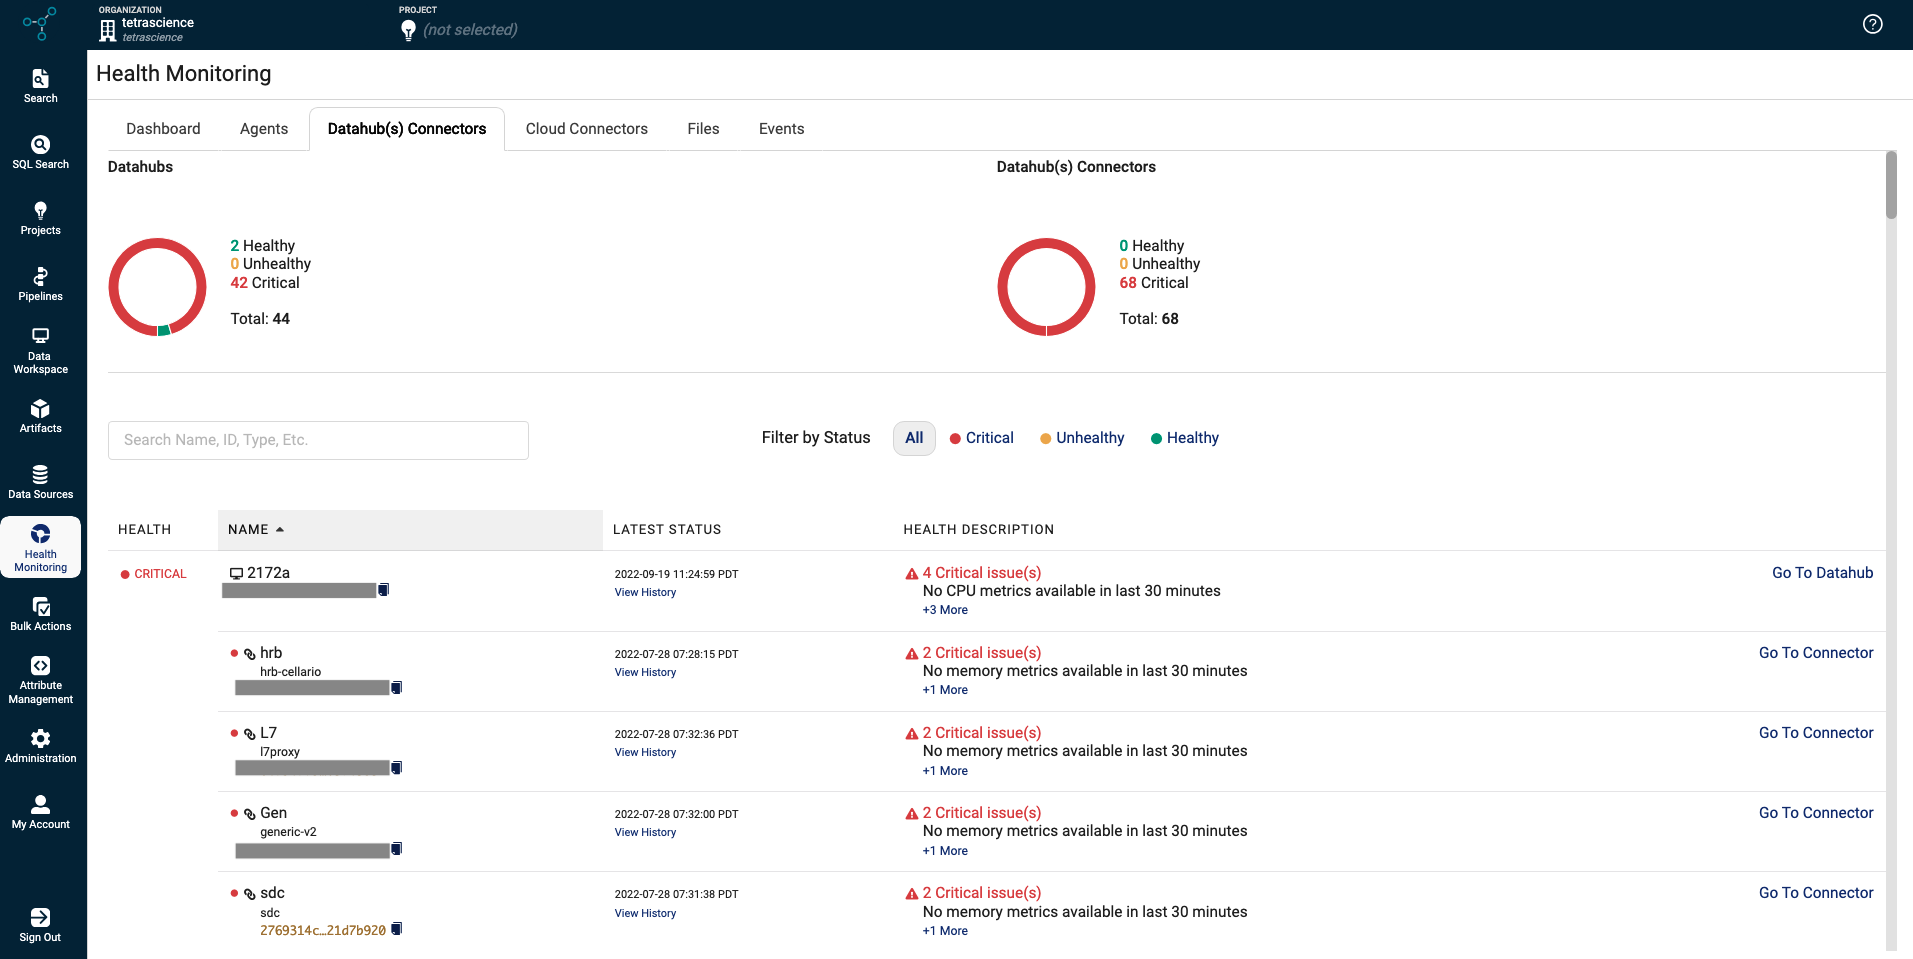
The aggregate status of Healthy, Unhealthy, and Critical Data Hubs and their associated connectors display as graphics at the top of the page. A Data Hub and their associated connectors may exist in these possible states:
State | Data Hub or Data Hub Connector | Event |
|---|---|---|
Healthy | A Data Hub is in a Healthy state when: |
|
Data Hub Connector is in a Healthy state when: |
| |
Unhealthy | A Data Hub is in an Unhealthy state when: |
|
A Data Hub Connector is in an Unhealthy state when: |
| |
Critical | A Data Hub is in a Critical state when: |
|
A Data Hub Connector is in a Critical state when: |
|
- To search for a component name, you can enter all (or a portion) of the Data Hub's name or unique identifier (UID) in the Search box.
- To apply a filter by status, you can also select All, Critical, Unhealthy, or Healthy next to the Search box.
This table describes the health details for the individual Data Hub or Data Hub Connector:
Field | Description |
|---|---|
Health | Displays the status for the Data Hub(s) and their connectors. By default, all status types display on this dashboard. |
Name | Name of the Data Hub and connector(s) (and their representative icons) You can hover over the Data Hub name to review these details:
You can hover over the connector name to review these details:
To sort the list of Data Hubs by name, click the arrow next to Name at the top of the column. You can sort items alphabetically, or in reverse order. To copy the unique ID for the component instance, you can click the copy file icon. |
Latest Status | When the latest status (Date/Time format) was assigned. To review a component's status history, click the View History link below the status. |
Health Description | Explains why the component has been assigned the critical state. By default, only one issue is shown. If there is more than one issue, then a link displays (for example, +1 More) indicating there are additional issues to review. |
Go To Data Hub | Provides a link you can click to review the configuration details for the particular Data Hub or connector. |
Updated 29 days ago