Monitor Cloud Connectors Health
The Cloud Connectors Health Monitoring Dashboard provides statistical information on the health of the cloud connectors you've configured in your Tetra Data Platform (TDP) environment.
Access the Cloud Connectors Health Dashboard
To view the Cloud Connectors Health Monitoring Dashboard, do the following:
- Sign in to the TDP as a user with Org Admin permissions.
- In the left navigation menu, choose Health Monitoring. The Health Monitoring Dasboard appears.
- From the Health Monitoring Dashboard, select the Cloud Connectors tab to view the Cloud Connectors Health Monitoring Dashboard.
NOTETo search for a component name, you can enter all (or a portion) of the Cloud Connector name or unique identifier (UID) in the Search box. To apply a filter by status, you can also select All, Critical, Unhealthy, or Healthy next to the Search box.
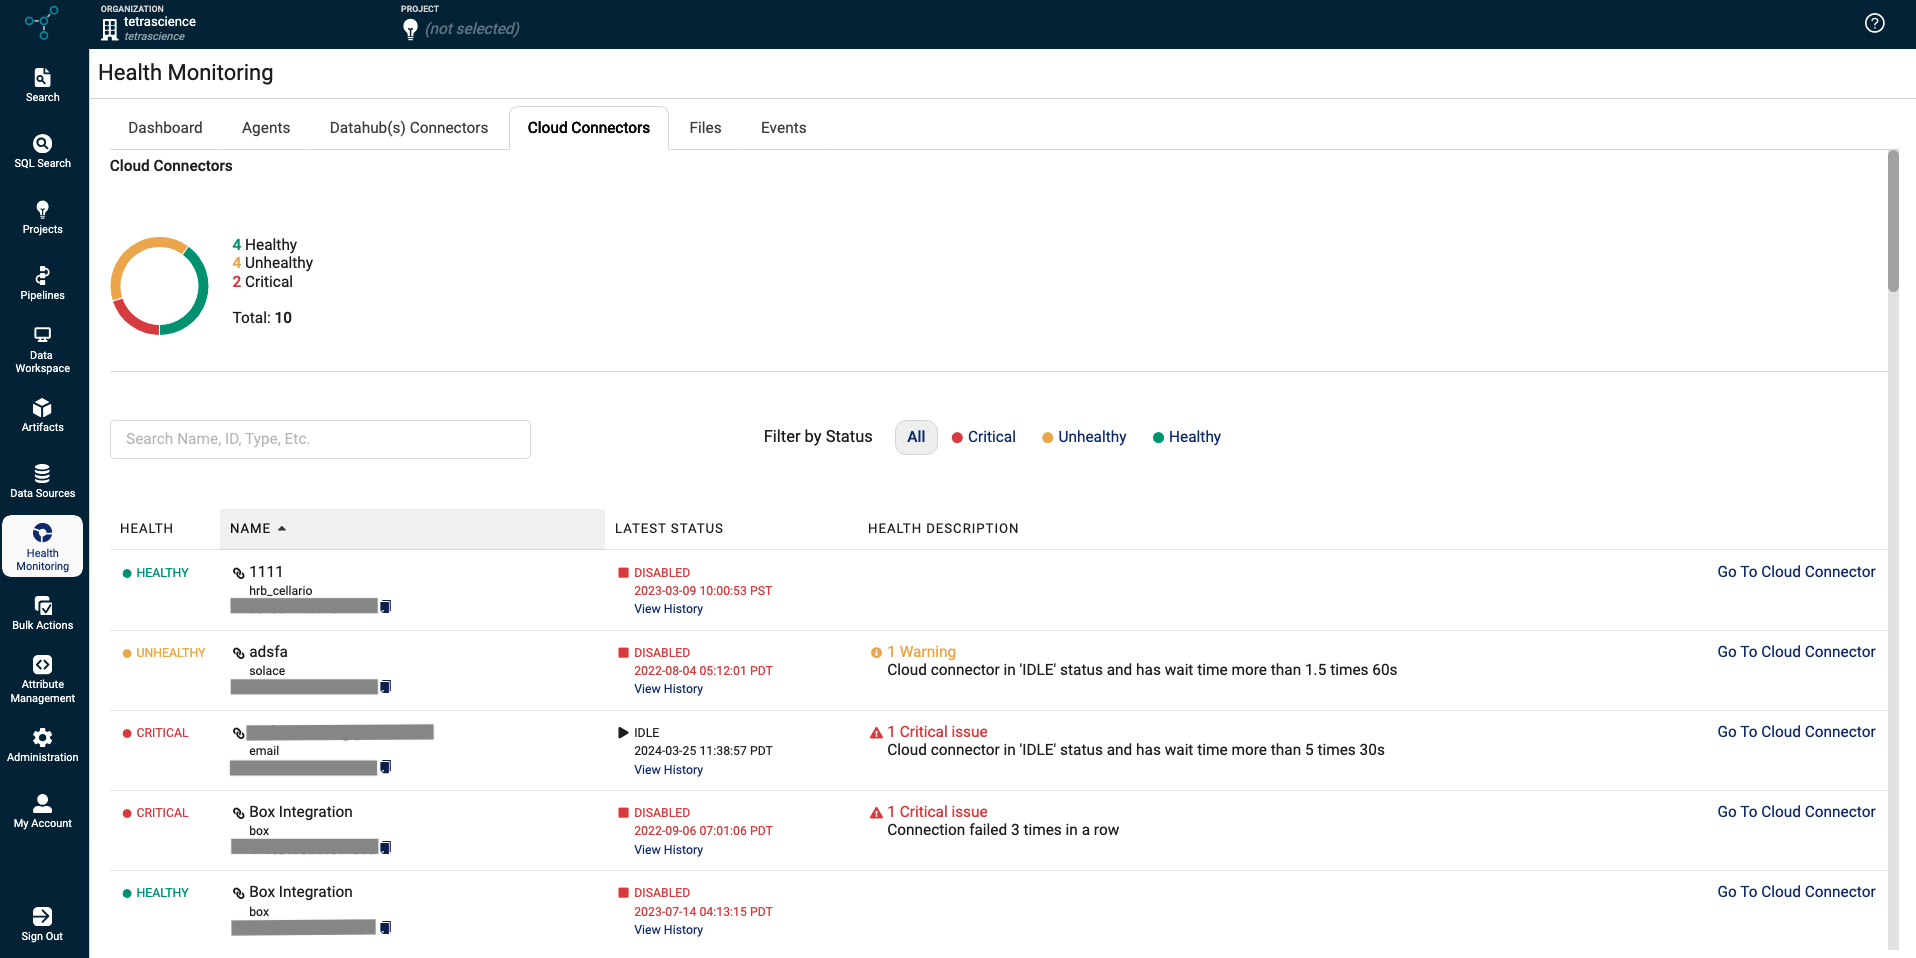
Cloud Connector Status
The aggregate status of Healthy, Unhealthy, and Critical cloud connectors display as a graphic at the top of the page.
A cloud connector can have any of the following statuses:
State | Event |
|---|---|
Healthy | A Cloud Connector is in a Healthy state when:
|
Unhealthy | A Cloud Connector is in an Unhealthy state when: |
Critical | A Cloud Connector is in a Critical state when:
|
Cloud Connector Details
The following table describes the health details provided for each Cloud Connector:
Field | Description |
|---|---|
Health | Displays the status for the Cloud Connector. By default, all status types display on this dashboard. |
Name | Name (and representative icon) of the Cloud Connector. To copy the unique ID for the component instance, you can click the copy file icon. |
Latest Status | When the latest status (Date/Time format) was assigned, and whether its currently Idle or has been Disabled. To review a component's status history, click the View History link below the status. |
Health Description | Explains why the component has been assigned the critical state. By default, only one issue is shown. If there is more than one issue, then a link displays (for example, +1 More) indicating there are additional issues to review. |
Go To Cloud Connector | Provides a link you can click to review the configuration details for the particular Cloud Connector. |
Updated 2 months ago