Tetra SDC Connector v2
The Tetra SDC Connector v2 is a standalone, containerized application that enables bi-directional communication between the Tetra Data Platform (TDP) and AGU Sm@rtLine Data Cockpit (SDC). SDC is a middleware that captures measurements from sensors and analyzers and exports them through REST API export interfaces. Users can configure the Connector to periodically poll export interfaces for sample and measurement results. The Connector also allows integrating systems to submit measurement order requests to SDC through the TDP Command Service.
Prerequisites
- AGU SDC version 3.0 or higher
- (Optional) Tetra Hub. You can deploy the Connector to an on-premises Tetra Hub instead of the cloud if networking access between SDC and the TDP is restricted. When deployed to a Tetra Hub, internal networking/firewall rules to allow communication between the Tetra Hub and SDC must be configured. For more information, contact your customer success manager (CSM).
Design Overview
AGU SDC exports measurements and sample results through REST API export interfaces. The export interfaces can be created by SDC admins and configured to export results from selected instruments in SDC. These export interfaces behave in a queue-like fashion.
The Tetra SDC Connector v2 periodically polls these interfaces for available results, and then uploads them to the TDP. Data ingestion capabilities were expanded from the Tetra SDC Connector v1 to support the upload of both measurement and sample results. Measurement orders can also be submitted to SDC programmatically by issuing commands through the TDP Command Service.
Architecture
The following diagram illustrates an example Tetra SDC Connector v2 deployment to replatform data from SDC to a single TDP organization:

SDC Connector V2 Architecture
Working with Multiple TDP OrganizationsWhen scaling an SDC integration across multiple TDP organizations, it's recommended that you create a separate export interface and Connector for each organization. Using different Connectors and export interfaces for each organization allows the TDP to handle the queue-like nature of SDC export interfaces with high data integrity. Connectors are also coupled to their TDP organizations.
Dataflow Example
The following diagram shows an example Tetra SDC Connector v2 dataflow:

SDC Connector V2 Dataflow
Operational Guide
To set up an integration between SDC and TDP using the Tetra SDC Connector v2, do the following.
Configure the SDC Export Interface
IMPORTANTIt's recommended that you create and configure a dedicated export interface in SDC for each Tetra SDC Connector v2 used in your TDP deployment. To mirror your SDC data across your TDP organizations, you must deploy a separate Connector for each of your organizations.
To create and configure export interface(s) in AGU SDC, do the following:
- Sign in to AGU SDC as an admin. Open the Export Interfaces page by doing the following:
- In the left navigation menu, choose Settings.
- Choose Interfaces.
- Select the Export Interfaces icon.
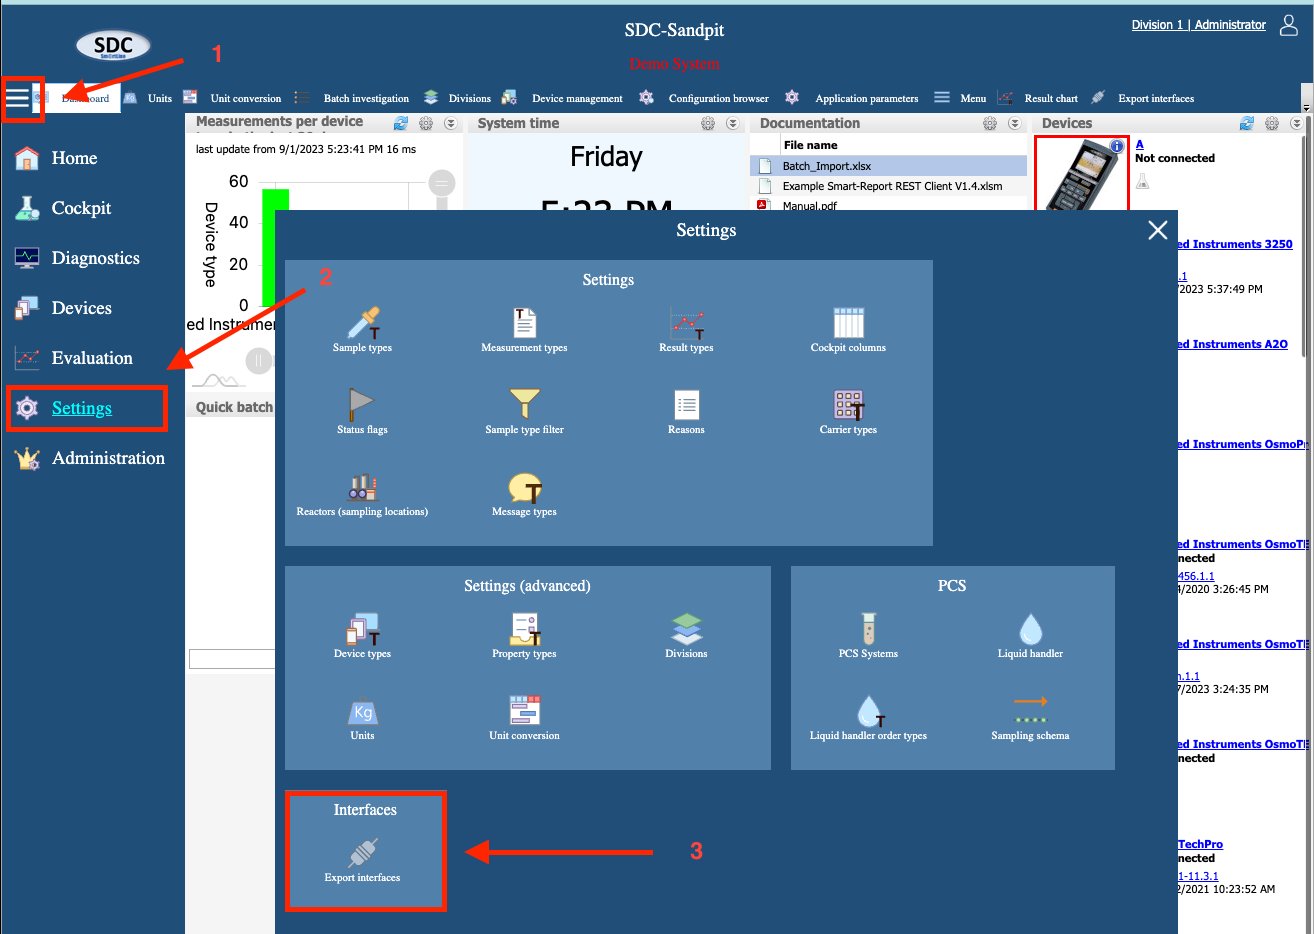
- Select the New button. The Create export interface workflow appears.
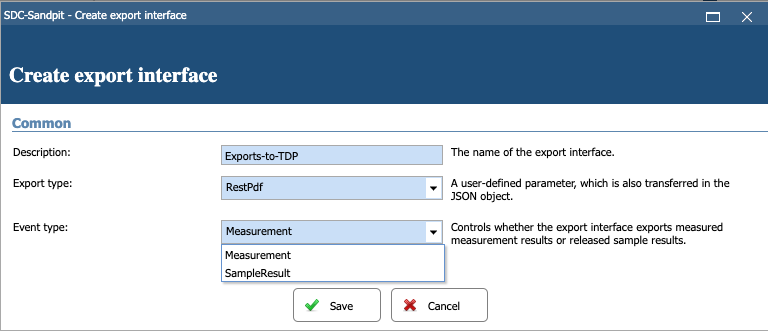
- Define the export interface by doing the following:
- For Description, enter a name for the export interface (for example, Exports-to-TDP)
- For Export type, select RestServer.
- For Event type, choose whether the interface exports measurement results (Measurement) or sample results (SampleResult).
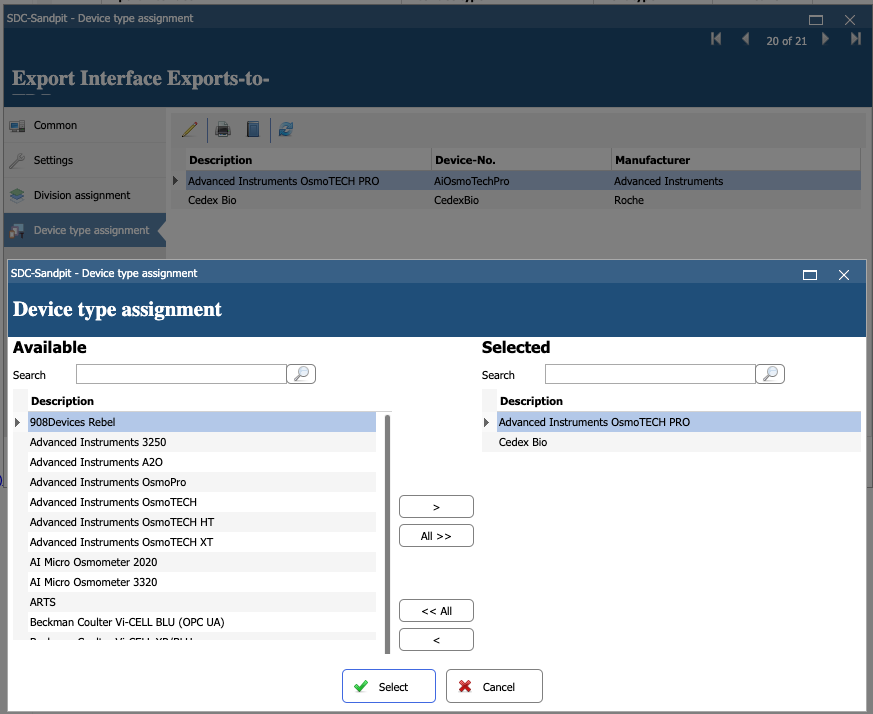
- Choose Save. The Export Interface Exports-to- workflow appears.
- Edit your export interface to match the following Common configurations:
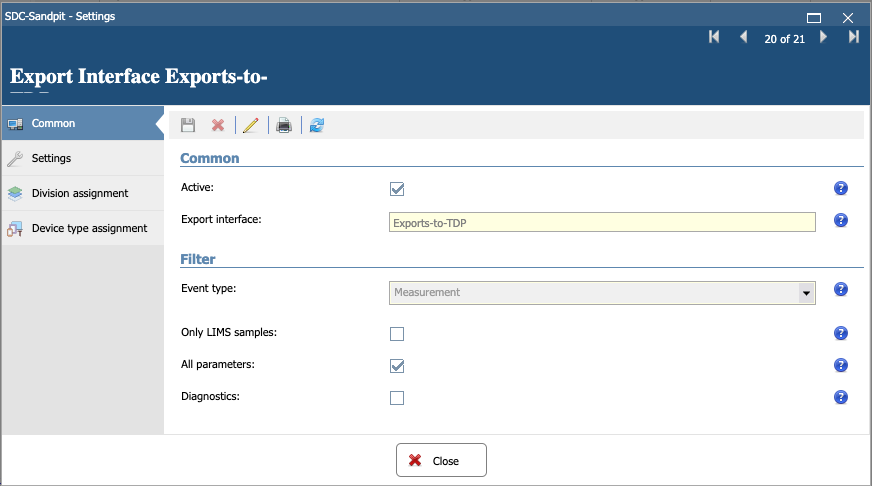
- For Active, select the check box.
NOTEActive interfaces add data to the queue. Inactive interfaces do not add data to the queue. However, inactivating a queue doesn't delete results from the queue; it only prevents new results from being added.
- For All parameters, select the check box.
NOTESelecting All parameters is required for proper file versioning in the TDP. If the All parameters check box isn't selected , then the exports will create partial files in the TDP, where each file contains a fraction of all results.
- (Optional) For Diagnostics, select the check box. This option isn't required, but is helpful for troubleshooting purposes.
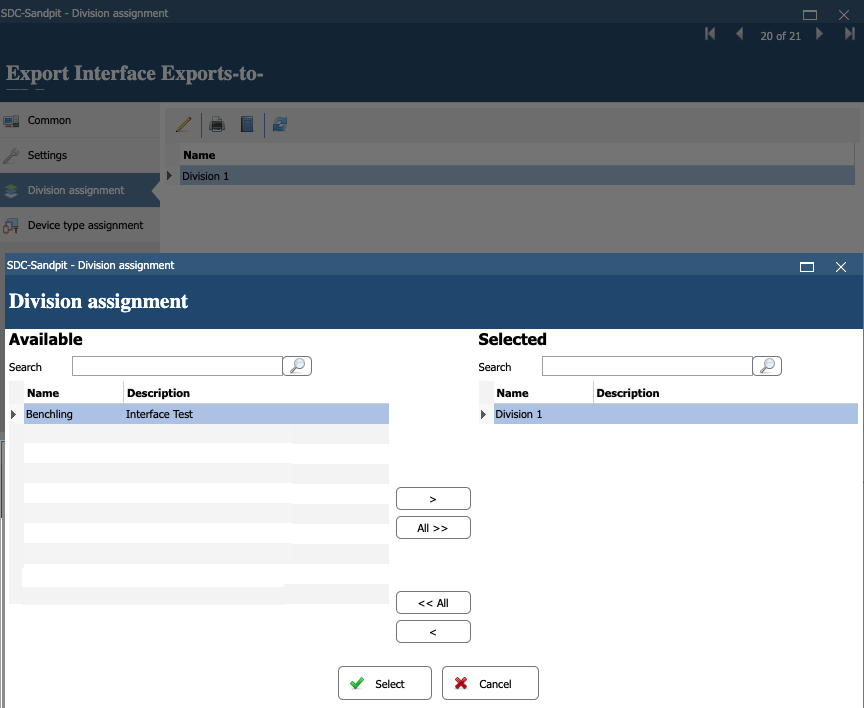
- Configure your export interface to export data from specific divisions in the Division assignment configurations.
- Configure your export interface to export data from a specific instrument make and model in the Device type assignment configurations.
IMPORTANTAGU SDC can't export data from a specific instrument ID. All instruments of a specific make and model export together.
Create a Tetra SDC Connector v2
To create a Tetra SDC Connector v2, do the following:
- Sign in to the TDP. Then, in the left navigation menu, choose Data Sources and select Connectors. The Connectors page appears.
- Follow the instructions in Create a Pluggable Connector. For CONNECTOR TYPE, make sure that you select common AGU SDC.
NOTEAfter the Connector is created, the initial MODE status is set to IDLE by default. To activate the Connector, you must configure its settings. For instructions, see the Configure the Connector section.
Configure the Connector
IMPORTANTIt's recommended to have a 1:1 relationship between the Tetra SDC Connector v2 in the TDP and your SDC export interfaces. If two Connectors poll the same export interface, then the integration may experience unpredictable behavior in SDC and the TDP when independent Connectors simultaneously poll the same export interface queue. Make sure that you review your Connector configurations carefully.
On the Connectors page, select the name of the connector that you created. Then, select the Configuration tab to configure the required settings.
Configuration Parameters
The following tables lists the configuration parameters that are required for the Tetra SDC Connector v2.
| Configuration Parameter | Description |
|---|---|
| SDC URL | URL for the SDC server including protocol, hostname and port. If port is not specified, the default port for protocol will be used (for example, https://yoursdcserver.com:8080) |
| Username | Username of the SDC user with permissions to create measurement orders and request data from an export interface. |
| Password | Password for the user. |
| Client ID | If provided, the Connector will use it for OAuth 2.0 authentication |
| Client Secret | If provided, the Connector will use it for OAuth 2.0 authentication |
| Measurement Result Export Interface IDs | Comma-separated list of SDC Measurement Result Export Interface IDs to poll (for example, 2, 4) |
| Sample Result Export Interface IDs | Comma-separated list of SDC Sample Result Export Interface IDs to poll (for example, 1, 3) |
| Polling Interval | Interval, in minutes, of how often data will be uploaded to the TDP. The minimum value is 1 minute. The default value is 10 minutes. |
| Max Results per Interval | Maximum number of results to upload per polling interval. If not specified, no limit is enforced. |
| Disable SSL Certificate Verification | If checked, SSL/TLS certificate verification is deactivated. The default value is false. |
Review and Edit the Connector's Information
The Information tab on the Connector Details page displays information about the Connector, the files pending, successfully uploaded, or failed. It also provides functionality to edit a Connector’s information, metadata, and tags.
To edit the Connector's information, select the Edit button on the Connector Details page's Information tab.
For more information, see Review and Edit a Pluggable Connector's Information.
Connector Details
The following table provides the Connector details available on the Information tab on the Connector Details page.
Field Name | Description |
|---|---|
CONNECTION |
|
NAME | Name of the connector |
NETWORK |
|
HEALTH |
|
MODE |
|
HOST |
|
CONNECTOR ID | The connector’s ID |
TYPE | Connector type |
VERSION | The connector’s version |
LAST SEEN | Last NETWORK check |
DESCRIPTION | User-defined connector’s description |
Connector Information That You Can Edit
The following table provides the connector information that can be edited after a Connector is created.
| Field Name | Description |
|---|---|
| Disabled/Enabled (toggle) | Toggle this field to enable/disable the connector |
| NAME | Connector’s name |
| DESCRIPTION | Connector’s description |
| CONNECTOR VERSION | Connector version |
| Add / Edit Attributes | Select this option to add or edit labels, metadata, and tags associated with the connector. |
Metrics
After a Connector instance is created and running, you can monitor the Connector’s health by selecting the Metrics tab on the Connector Details page. The Metrics tab displays the Connector's container metrics as well as aggregated states on total files scanned and uploaded as well as files that returned errors or are pending.
Integrate Data
Measurement and sample results that are exported to configured exported interface(s) will be uploaded to TDP. After data is uploaded to the TDP, you can enrich and harmonize the data by using any of the following available scripts, protocols, and intermediate data schemas (IDS):
- Task script:
common/sdc-measurement-raw-to-ids:v2.0.0 - Protocol:
common/sdc-measurement-raw-to-ids:v2.0.0 - IDS:
common/agu-sdc:v2.0.0
Submit Measurement Order
Measurements can be created programmatically in AGU SDC through a TetraScience CreateMeasurementOrder command.
To create a TetraScience TetraScience.SDCConnector.CreateMeasurementOrder command, an API call must be made to the Create Commands API. The Connector passes the payload.measurementOrderRequestBody to the SDC REST API.
Required parameters
SampleNumberSampleTypeDeviceNumber
The following command data can be posted to the Command API to make a measurement in the SDC Sandbox:
{
    "targetId": "7e71ceea-0503-4031-9b56-97c686245e25",
    "action": "TetraScience.SDCConnector.CreateMeasurementOrder",
    "expiresAt": "2025-12-30T23:58:43.749Z",
    "payload": {
        "ttl": 600,
        "measurementOrderRequestBody": {
            "SampleNumber": "Sample987",
            "ExternalId": "LIMS12345",
            "SampleType": "Advanced Instruments OsmoTECH PRO default",
            "DeviceNumber": "AIOsmotechPro123456"
        }
    }
}| Parameter Name | Required | Description |
|---|---|---|
targetId | Yes | Connector UUID from the Connector Details page |
action | Yes | Must be TetraScience.SDCConnector.CreateMeasurementOrder |
expiresAt | Yes | Deadline after which incomplete commands are considered expired |
payload.ttl | No | Numeric timeout for the HTTP request, in seconds ( Connector default is 300,000) |
payload.measurementOrderRequestBody | Yes | These contents are posted to SDC’s REST API /SDC/Measurements, and are handled by SDC directly. The requestBody contents can vary based on which instrument is used. For more information, see the SDC User Manual and REST Configuration procedure. |
Updated 3 months ago