Monitor Tetra Agents Health
You can use the Tetra Agents Health Monitoring Dashboard in the Tetra Data Platform (TDP) to assess the health and performance of the following Windows-based Agents:
- Tetra Chromeleon Agent
- Tetra Empower Agent
- Tetra File-Log Agent
- Tetra LabX Agent
- Tetra UNICORN Agent
NOTETo view the health and performance of a Tetra IoT Agent, see Viewing Existing Tetra IoT integrations.
Access the Agents Health Monitoring Dashboard
NOTEIt can take up to six minutes for any status changes that you make in the Agent Management Console to appear in the TDP Health Monitoring Dashboard.
The connection (heartbeat) between the TDP and an Agent is checked automatically every five minutes. If the TDP doesn't receive a heartbeat message for more than five minutes, the platform assumes that the Agent is offline.
To view the Tetra Agents Health Monitoring Dashboard, do the following:
- Sign in to the TDP. Make sure that you use an Administrator account.
- In the left navigation menu, choose Health Monitoring. The Health Monitoring Dashboard appears.
- Select the Agents tab. The Agents Health Monitoring Dashboard appears.
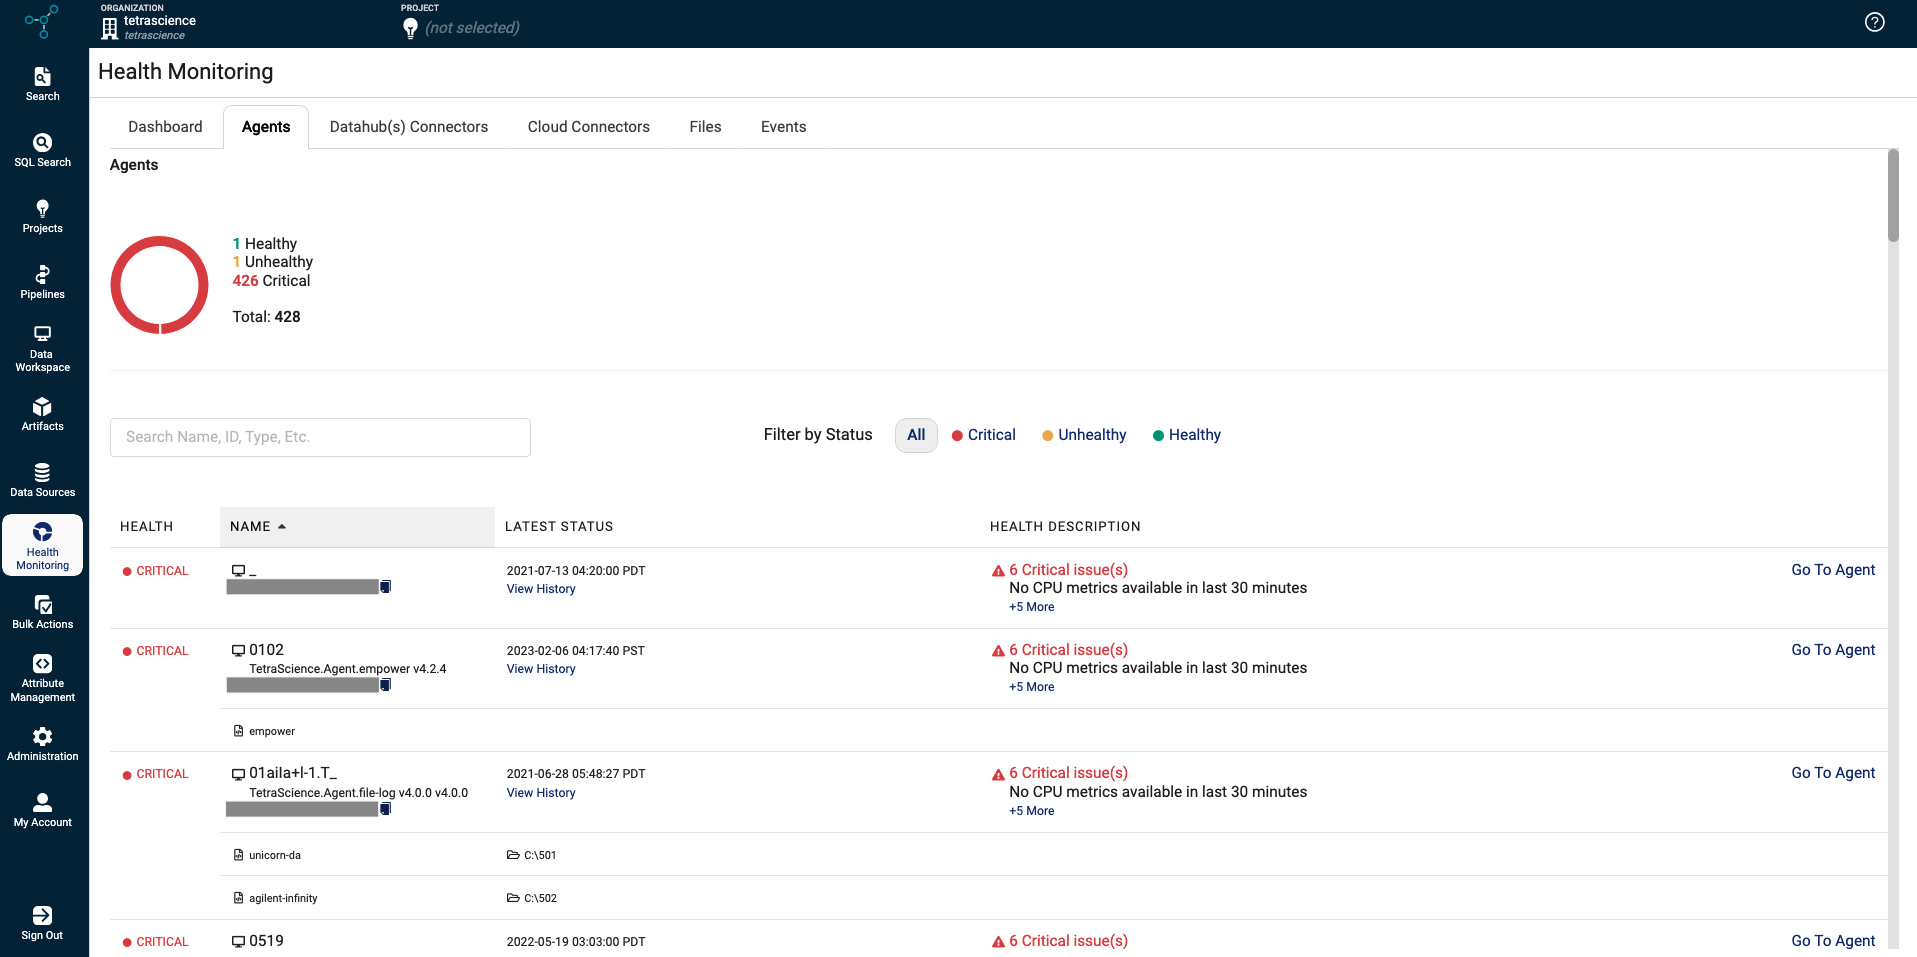
Search and Filter Options
To search for a specific Agent, enter either an Agent’s name or unique identifier (UID) in the upper left search box.
To filter by status, select one of the health status types listed next to Filter by Status.
Agent Health Statuses
A Tetra Agent can be in one of three statuses: Healthy, Unhealthy, or Critical. For more information about each status type, see the following table.
State | Event |
|---|---|
Healthy | A Tetra Agent is in a Healthy status when all of the following is true:
|
Unhealthy | A Tetra Agent is in an Unhealthy status when any of the following is true:
|
Critical | A Tetra Agent is in a Critical status when any of the following is true:
|
Agent Health Monitoring Dashboard Details
The Agent Health Monitoring Dashboard provides the following details.
Field | Description |
|---|---|
Health | Displays the status for the Tetra Agent. By default, all status types display on this dashboard. |
Name | Name (and representative icon) of the Tetra Agent that is currently in the critical state. You can hover over the Tetra Agent name to review the following details:
To sort the list of Tetra Agents by name, select the arrow next to Name at the top of the column. You can sort items alphabetically or in reverse order. To copy the unique ID for the component instance, select the copy file icon. |
Latest Status | When the latest status (Date/Time format) was assigned, and whether it's currently Active or has been Disabled. To review a component's status history, select the View History link below the status. |
Health Description | Explains why the component has been assigned a specific health state. By default, only one issue is shown. If there is more than one issue, then a link displays (for example, +3 More) indicating there are more issues to review. |
Go To Agent | Provides a link you can select to review the configuration details for the Agent. |
Updated 3 months ago