Tetra SDC Connector
AGU SDC (Sm@rtLine Data Cockpit) captures measurements from sensors and analyzers and gives the ability to export them via REST API using the Smart Reports feature. Tetra Data Platform has a built-in integration that allows users to pull SDC measurements as JSON files into the Tetra Data Lake.
Pipeline Configuration
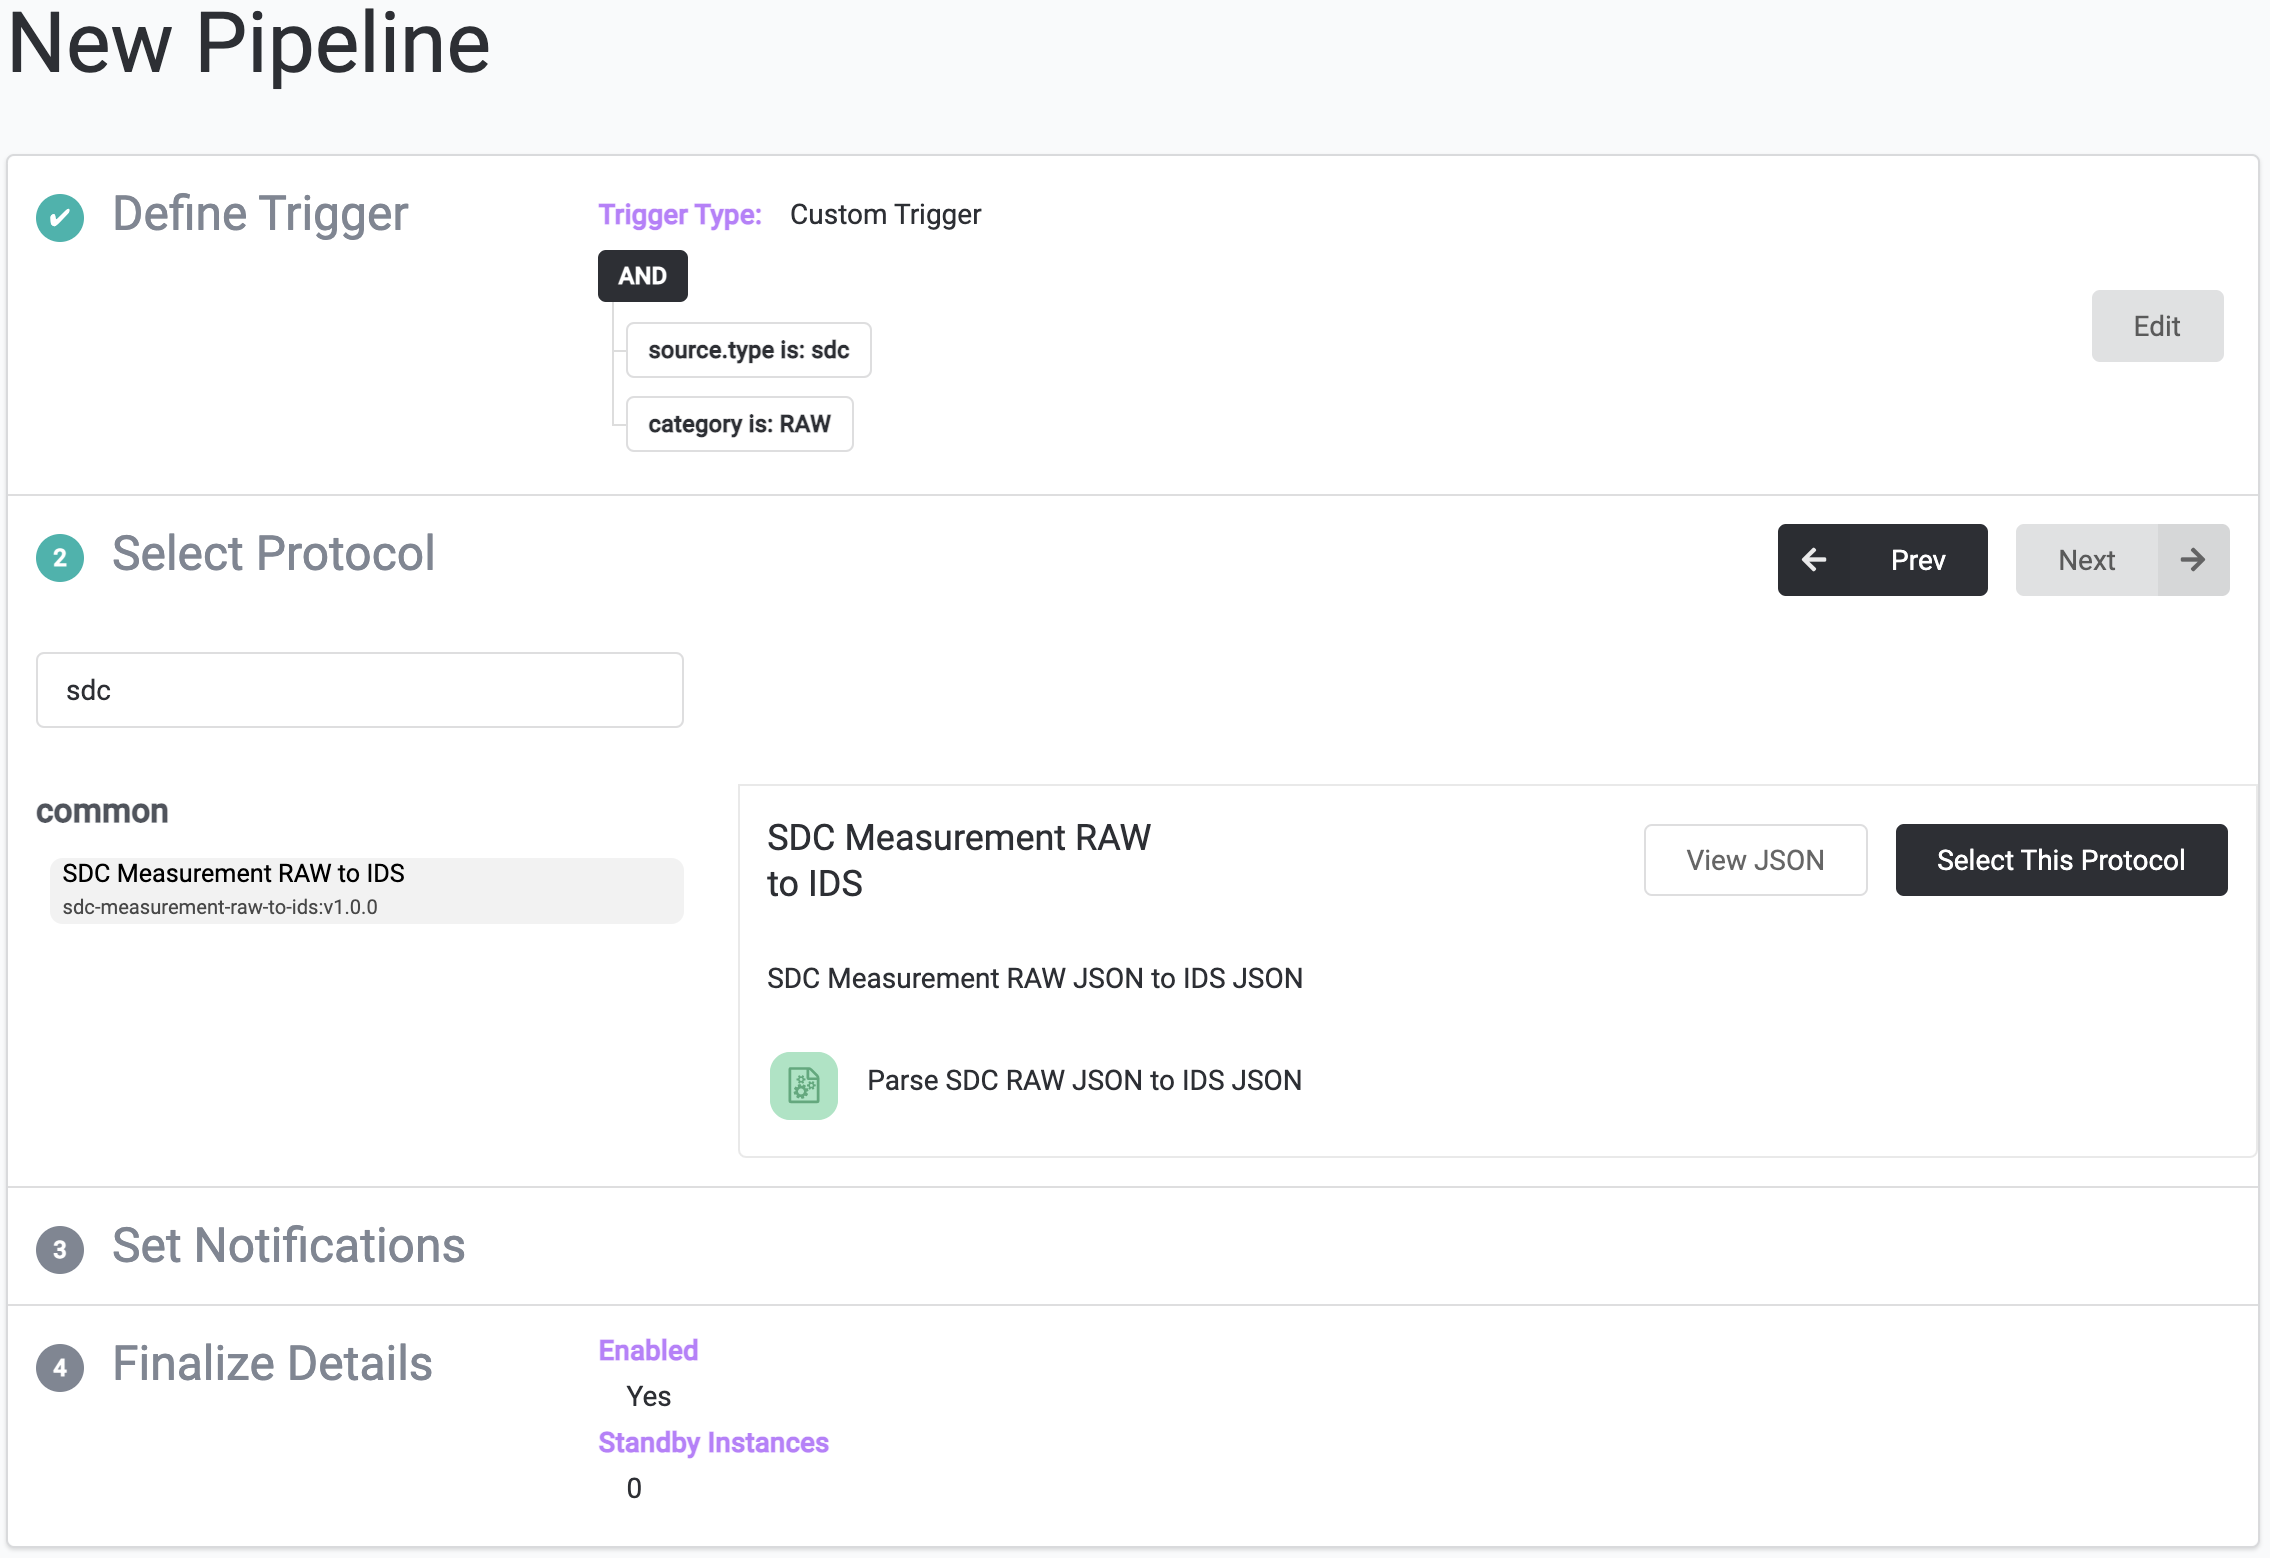
Create a new pipeline.

Create new SDC Measurement RAW to IDS pipeline
The pipeline will be triggered by a RAW file appearing in the Tetra Data Lake where the source.type is sdc and the category is RAW.
The pipeline will use the SDC Measurement RAW to IDS protocol.
Setup desired notifications.
Provide a pipeline name. Best practice is to use the protocol as the pipeline name.
SDC Setup Requirements
SDC supported version is 2.8.9.2 or higher
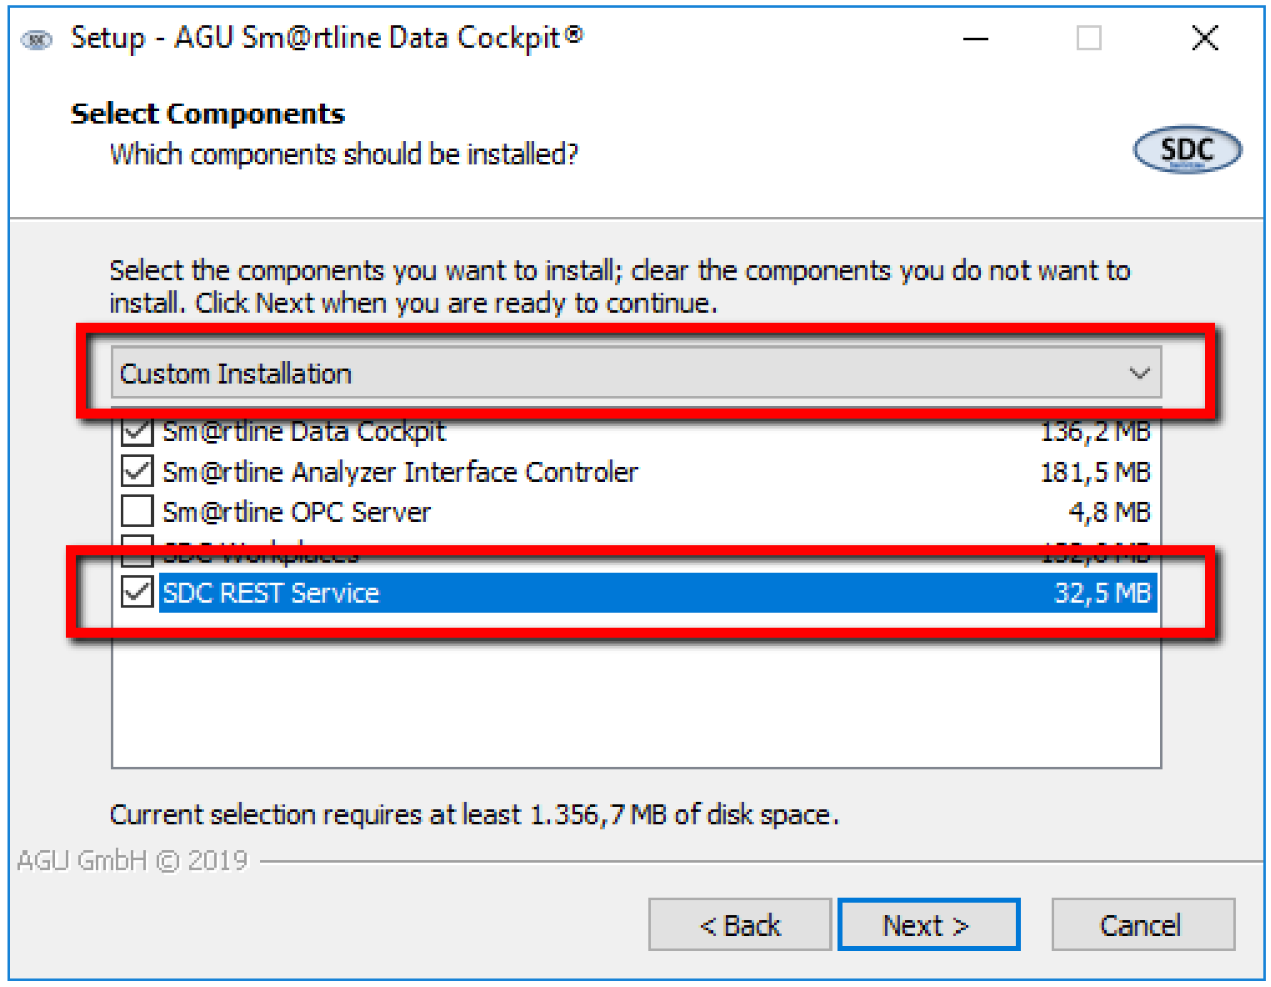
SDC REST Service component should be installed

ExportedMeasurements Smart Report (designed by AGU) must be enabled
This Smart-Report is available in the installation folder SmartReports on the SDC application server.

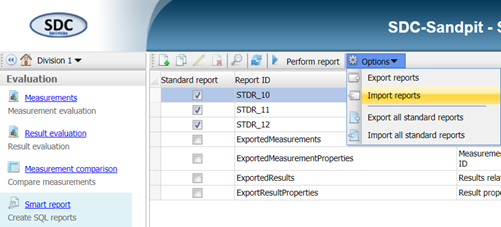
Smart-Reports are packed in one file and can be uploaded to SDC by admins or key users.
Export Interface must be configured
To create the required export interface, the admin or key user must select the “Export management” menu and press the + button. The type of export interface must be “custom” and the event type must be “Measurement”. The user can then decide which division and which analyzer types should create interface events.

Verify Network Requirements and Setup
SDC integration requires network connection to the SDC API endpoint. Typically, you will need to open up the port used for connection on your firewall. To verify your SDC is set up properly for integration, please follow the steps below on the DataHub machine to make sure Tetra SDC Connector (running on the DataHub machine) can access your SDC instance.
Step 1: Verify network connection and authentication
curl --location --request GET 'https://your.sdc.net/SDC/Measurements' \
--header 'Authorization: Basic xxxxxxxxxx'
cURL
To test network and API connection using cURL, you may follow
this guide
Basic authentication
Basic authentication is a simple authentication scheme built into the HTTP protocol. The client sends HTTP requests with the
Authorizationheader that contains the wordBasicfollowed by a space and<username>:<password>as a base64-encoded string. For example, to authorize as<username>:<password>the client would send the following:
Authorization: Basic <credentials>
Step 2: Verify smart report is available
curl --location --request GET 'https://your.sdc.net/SDC/Smartreports' \
--header 'Authorization: Basic xxxxxxxxxx'
Confirm that "ExportedMeasurements" is available in the response
Step 3: Verify the Export Interface Id
The "ExportedMeasurements" is associated with an Export Interface Id, which is provided by your SDC admin. Running the following HTTP request should yield expected Exported Measurements, not an empty response.
curl --location --request POST 'https://your.sdc.net/SDC/Smartreports/ExportedMeasurements' \
--header 'Authorization: Basic xxxxxxxxxx' \
--header 'Content-Type: application/json' \
--data-raw '{
    "InterfaceId": "<your_interface_id>",
    "LastInterfaceResultId": "0"
}'
How to configure Tetra SDC Connector
Add SDC Integration configuration
-
Click the "hamburger" button on the upper left corner and a sidebar will pop out on the left, click "SDC" under "Data Sources" menu
-
Click "Add SDC integration"
-
Enter SDC REST API details:
- URL: REST API endpoint (without trailing slash)
- Username
- Password
- Client ID: may be arbitrary value and will be used for OAuth authorization with SDC REST API
- Client Secret: value used on SDC REST Service setup
- Accept self-signed certificates: if your setup uses self-signed certificate make sure this is checked, otherwise Tetra Data Platform won't be able to access SDC REST API
-
Click "Login" button to make sure login information is correct
-
Click "Create" to save setup information.
Add a New Source
-
Click "+ Add source" on created integration add source information.
-
Provide source details:
- Export Interface ID: id of Export Interface from SDC (e.g. 1). This number is accessible to SDC admins in: "Settings" -> "Export Management". Non-admins will have to contact their admins to identify this number.
- Load historical data: when checked, measurements which were added before Exported Measurements report was configured, will be imported without associated Export Interface ID as historical records.
-
Click "Validate" button to make sure your SDC setup is valid. If it fails, please make sure you have ExportedMeasurements Smart Report setup and configured.
-
Move next to add name and description and click Next.
-
Add any metadata and tags and click Finish.
Your SDC integration is configured.
If you selected Load historical data you will see files loading when you go to Search Files in TDP UI.
How to configure SDC Connector on DataHub
- Setup DataHub
- Click "+ Add Connector" button on created DataHub
- Select "SDC connector" from the list
- Enter connector name
- Enter SDC REST API connect information (see details above)
- Move forward to complete setup
Notes on SDC Connector
The SDC Connector was developed and tested using SDC version 2.8.9.2
Frequently Asked Questions
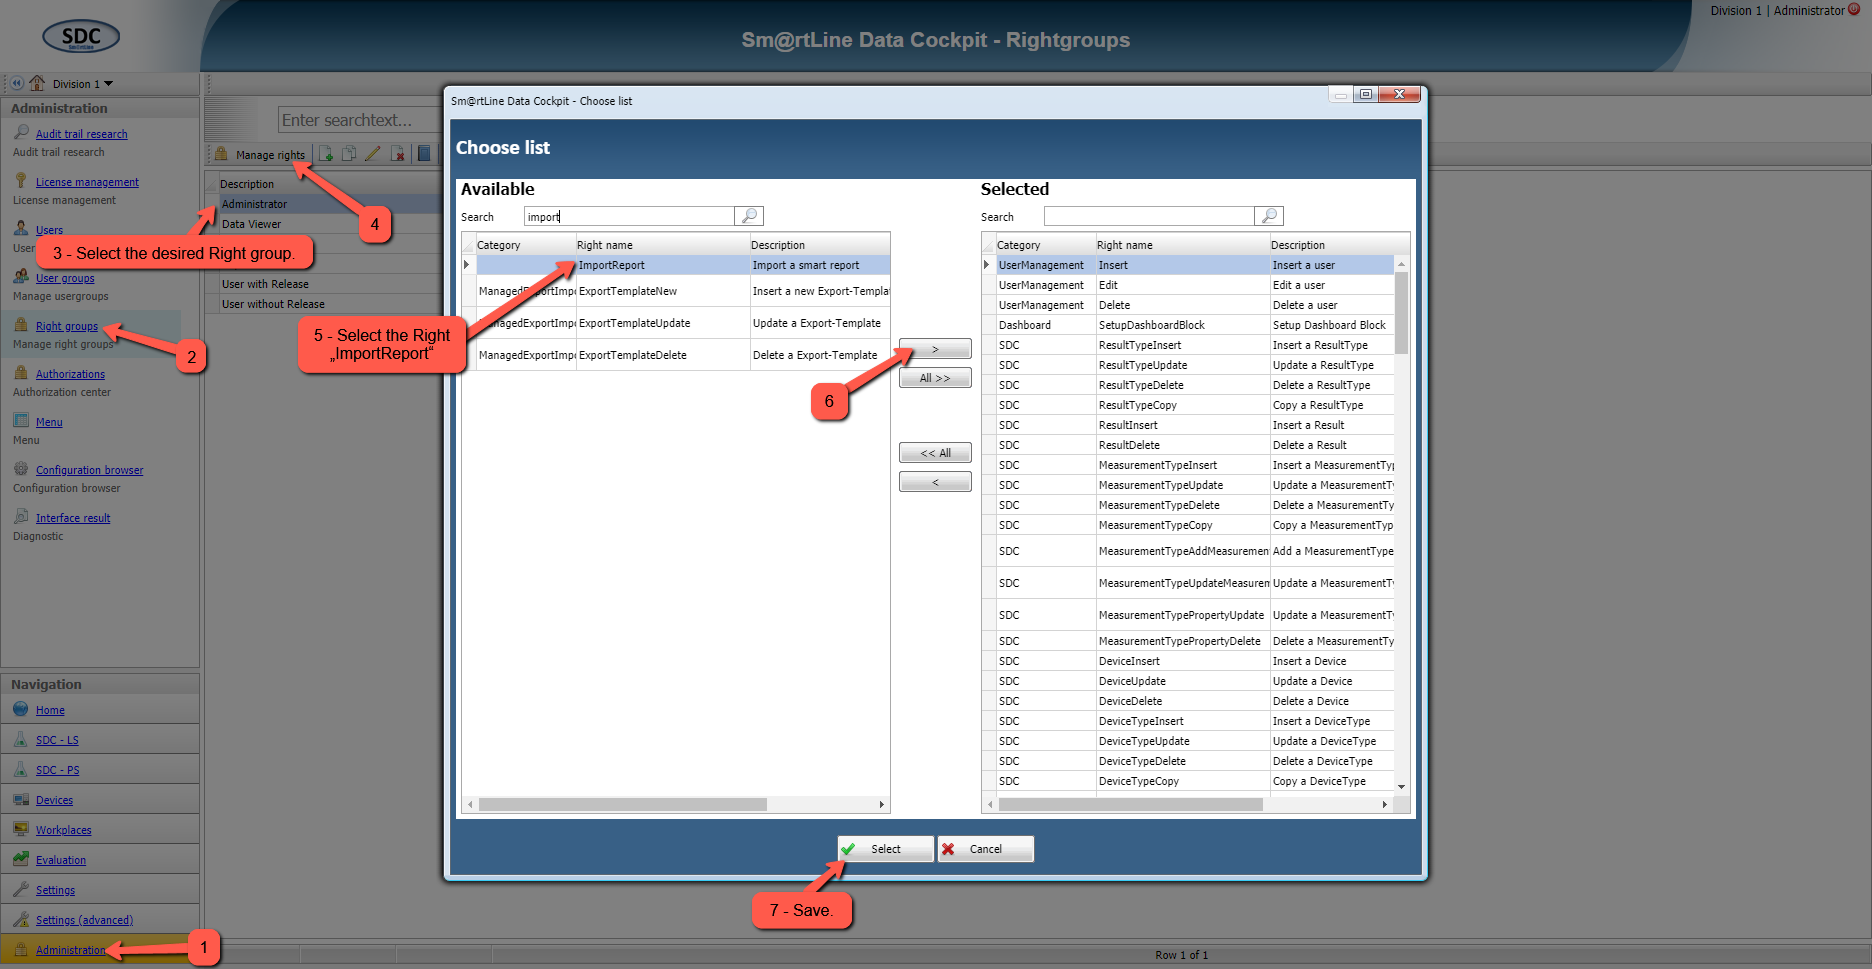
1. Why does "Import Reports" not show up as an option as depicted above?
The Admin needs to insure that the user has the right to import reports. You can check that through the following steps:

Reports
Updated about 1 month ago
