Connect to Athena Tables from TIBCO Spotfire
Amazon Athena is an interactive query service that allows you to use standard SQL to view and analyze data in your organization's Tetra Data Lake S3 bucket. This page describes how to connect to your Athena tables from the TIBCO Spotfire third-party tool.
Before You Begin
Before you can use TIBCO Spotfire as a third-party tool to connect to Athena tables, you must have:
- Downloaded an Athena JDBC driver
- Deployed the JDBC driver to TIBCO Spotfire, deployed the JDBC JAR file to Spotfire's Tomcat, restarted the Spotfire server, and configured the Data Source Template. Click here for the specific Spotfire documentation procedures to complete these tasks.
- Located connection details from the Tetra Data Platform (TDP)
Connect to Athena Tables from TIBCO Spotfire
- Set Up a Data Source
- Example: Create a Simple Visualization Using Athena Tables as a Data Source
Set Up a Data Source
After you have configured the TIBCO Spotfire server, you can configure the TIBCO Spotfire client.
To connect to Athena tables from TIBCO Spotfire:
- From the Spotfire Client, navigate to Tools -> Information Designer.
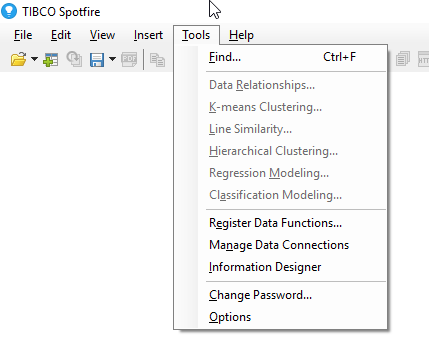
Spotfire Client
- Select Data Sources, and then click Setup Data Source on the right side of the page.
Setup Data Source
- Add the connection details (username, password, and URL) you previously obtained from the SQL Access page of the Tetra Data Platform.
Connection URL Parameters
The connection URL also contains parameters. You must use the following format:
jdbc:awsathena://AwsRegion=us-east-2;S3OutputLocation=s3://ts-athena-results-us-east-2-staging/demo;athena.us-east-2.amazonaws.com:443
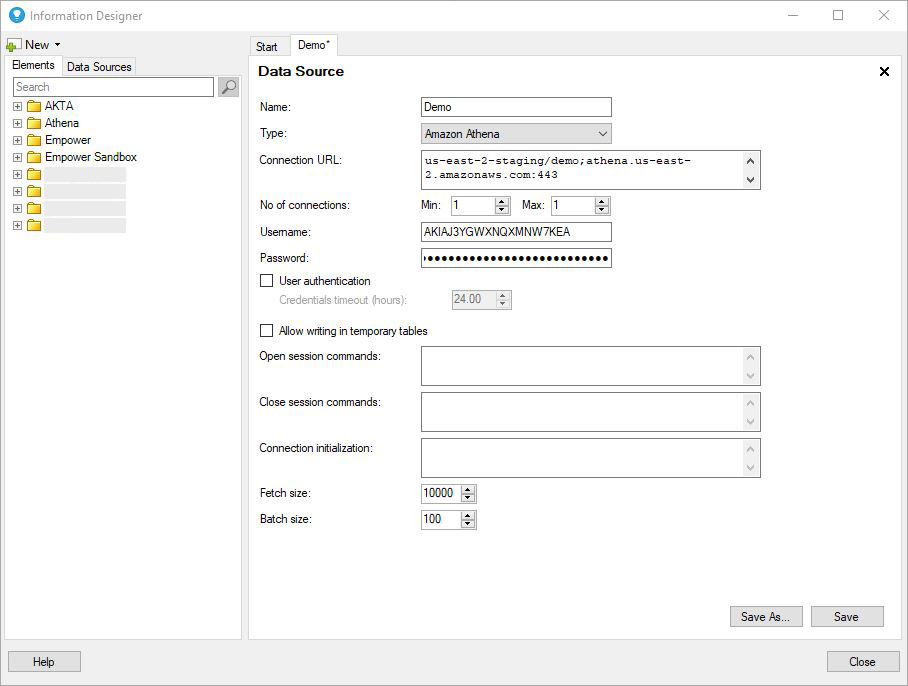
Add Connection Details
- After you have completed entering the information, click Save As... to save the information as a new Data Source at the appropriate location, and then click Save. If there is an error with the connection (for example, wrong URL or missing parameter), an error displays and the system prevents you from saving the data source until the issue is corrected.
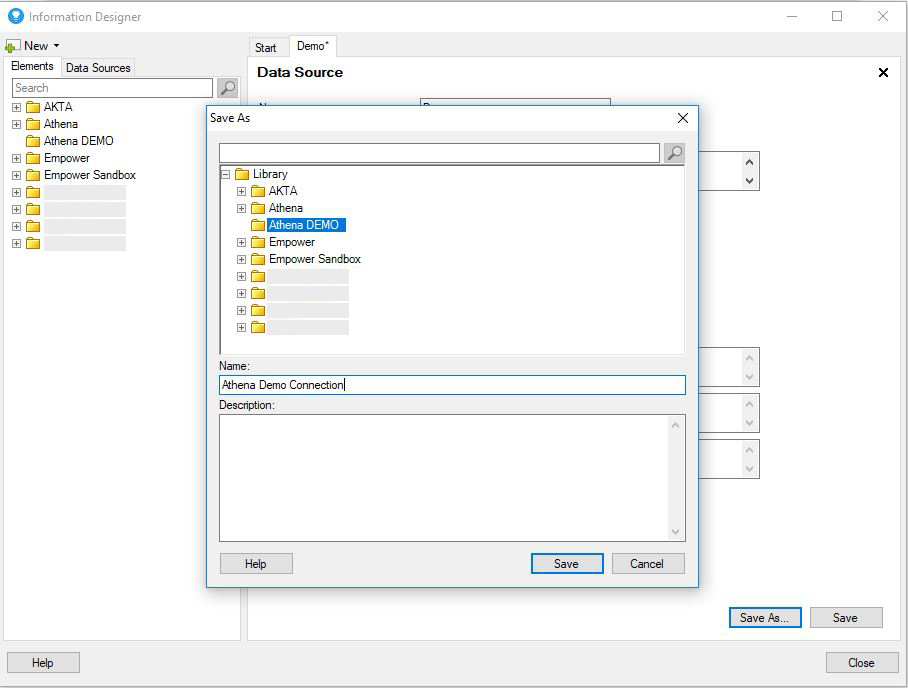
Save Data Source
Example: Create a Simple Visualization Using Athena Tables as a Data Source
The next procedure provides an example of how to create simple visualization using Athena tables as a data source.
- Map a table column to a Spotfire column. To map multiple table columns simultaneously, click Multiple Columns.
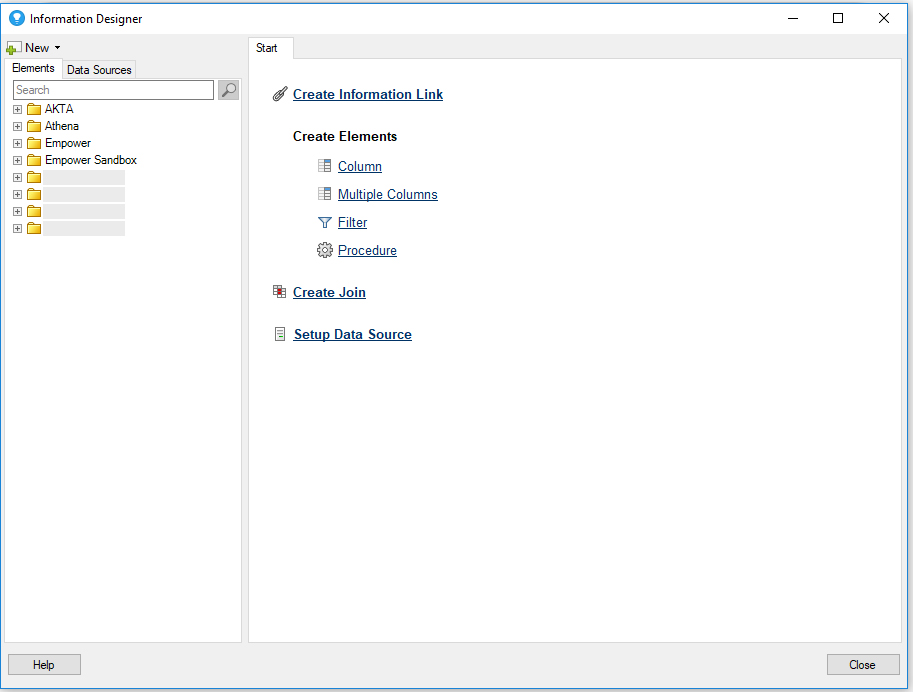
Map Multiple Columns
- The dialog changes. From the left side, navigate to the Athena table you want to map to Spotfire. You can select one column, or multiple columns, or whole the table. Select the information you want and click Add >.
Select Information
- Click Create Columns to open a dialog showing where to save mapped columns. For better organization, we recommend that you save the columns in a dedicated subfolder for given project. Click Create Columns.
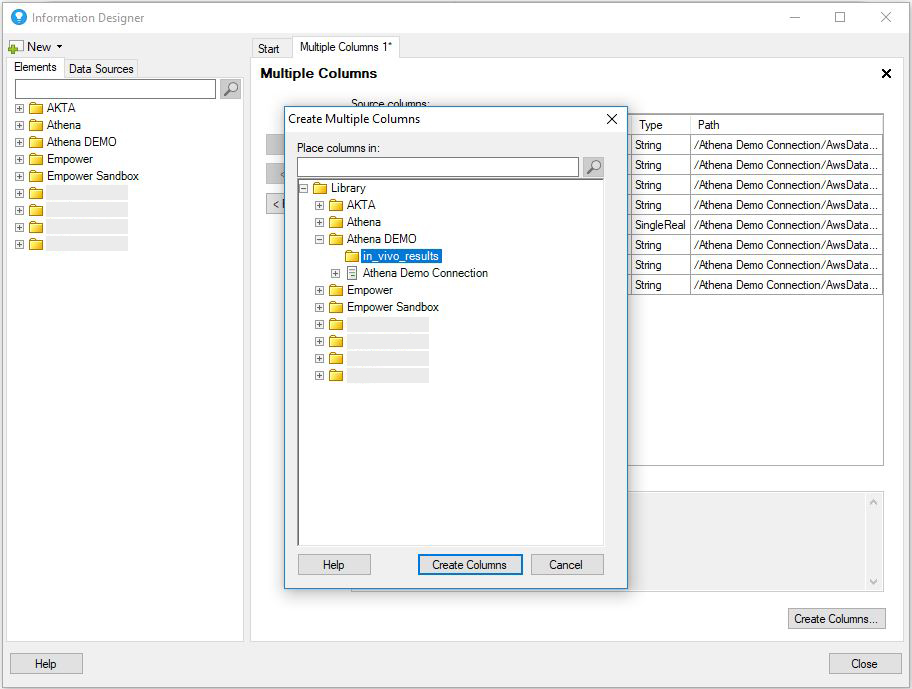
Create Columns
- Create an information link (the actual data source). It is the SQL query that is executed to fetch the data from Athena. Click Create Information Link.
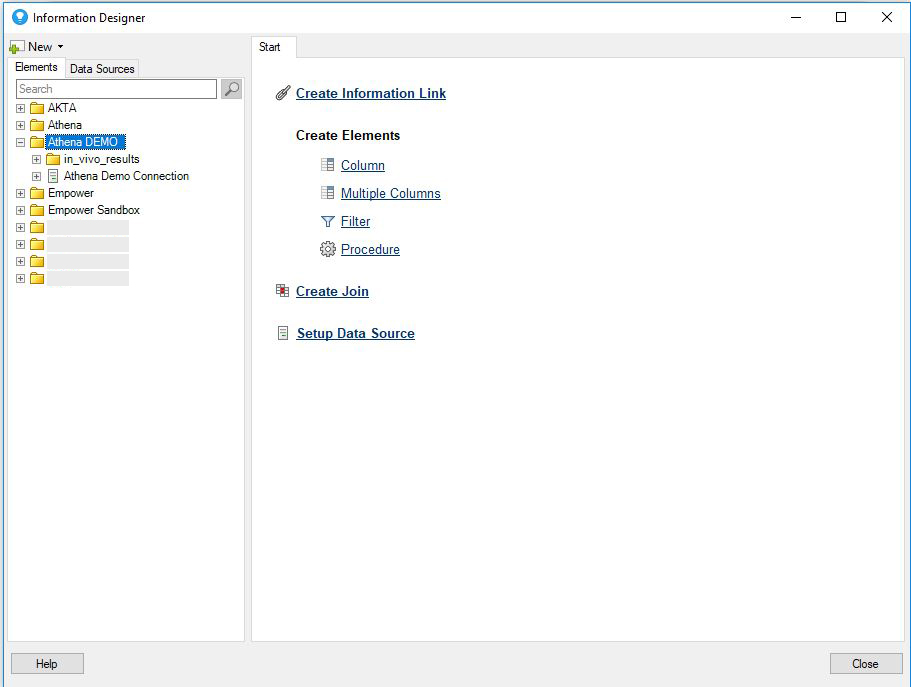
Create Information Link
- The Information link dialog displays. The Information link accepts only mapped columns that are saved in the Spotfire library. To navigate to columns created in step 4, click Elements. Select the desired columns and add them to the right side by clicking Add >. This dialog also contains these additional options you can set: Parameters, Prompts, Join Paths, Filters, Caching, and more. Click SQL... to display the SQL statement that will be executed to fetch the data.
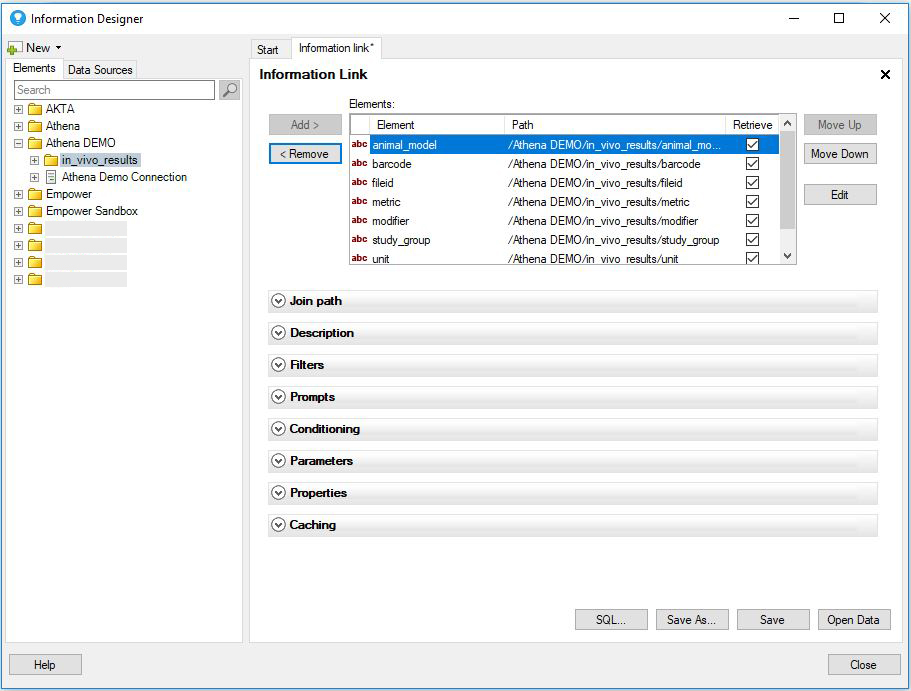
Information Link Options
- You can edit and modify the SQL, if needed. Close the SQL dialog and click Save As...
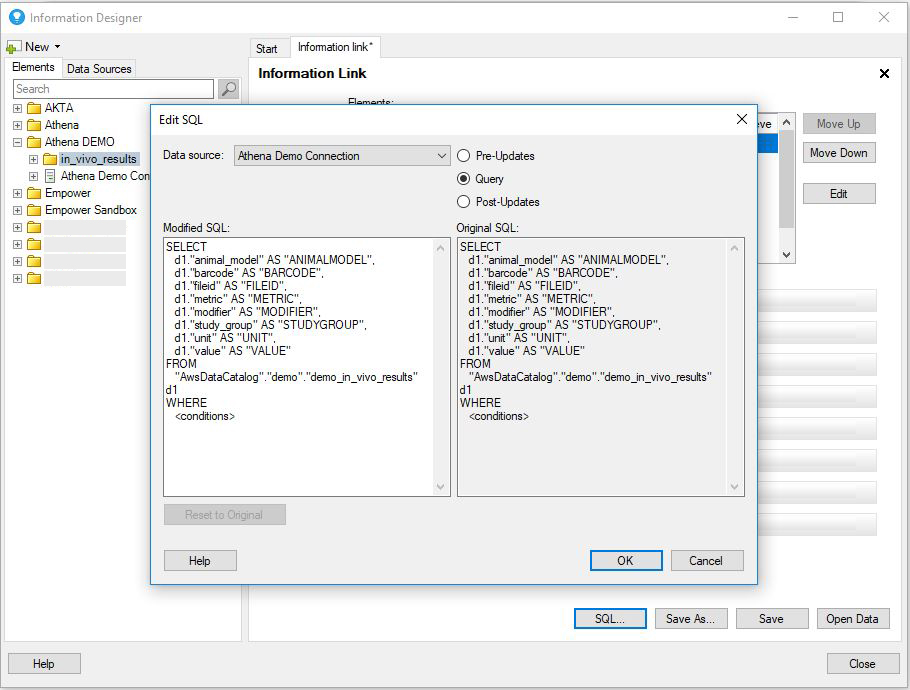
Modify SQL
- The system prompts you for the location of where to save information link. We recommend that you save the link at the appropriate location.
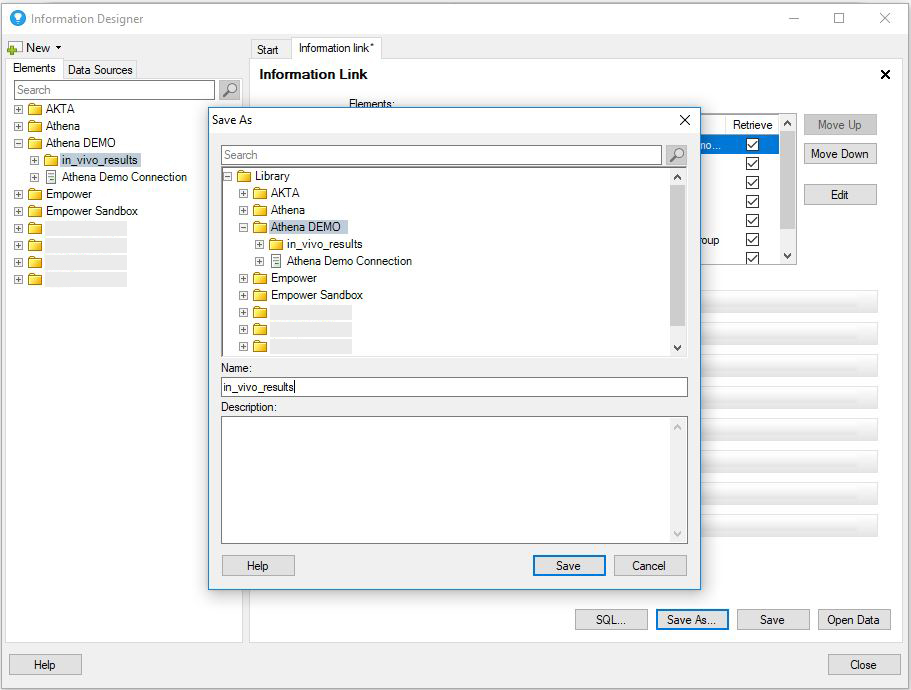
Save Information Link
- To create the data visualization, select File -> Add Data Tables...
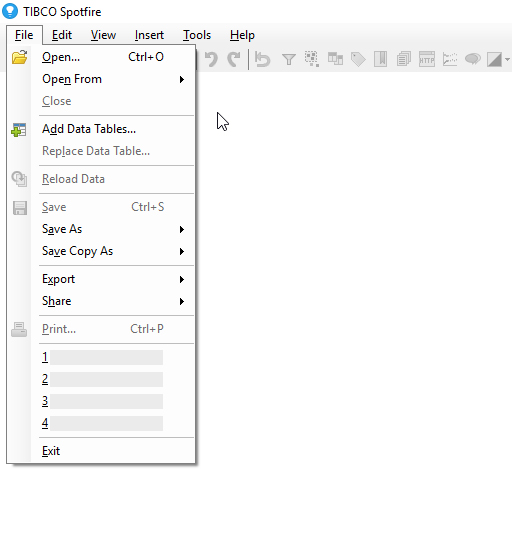
Add Data Tables
- Data tables support multiple options as a data source. In this example, we will use the information link that we previously created. Click Add and select Information Link....
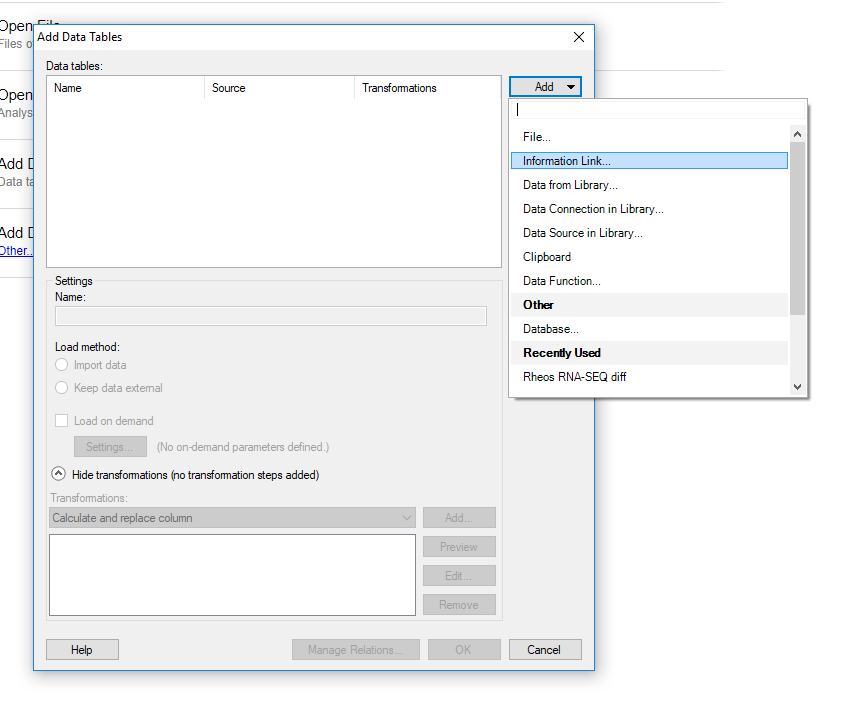
Add Information Link
- From the library, navigate to the location where the information link is saved in step 7.
Information Link library
- The system provides several options for the data table. Click OK.
Data Table options
At this point, Spotfire will trigger SQL and will fetch the data from Athena. Based on the source size and provided SQL, the query may take some time to process.
Loading Data
- After Spotfire completes loading the data from the source, a dialog displays showing recommended visualizations. Recommendations depend on the selected columns. You can either accept the recommended visualization, or you can click Close to manually add visualizations.
Recommended Visualization
- All available visualizations are located in the palette at the top of the page:
Visualization palette
- You can add a simple table that includes all of the columns and is basically the purest representation of what is in the table.
Simple Table
- You can also add Filter from the palette. Filter includes all of the columns and the system recognize text and numerical columns. For numerical columns, filters are in form of range bar. For text columns, depending on the number of different values, Filter will display either: checkboxes, a select list, or a simple edit box. Changing the filters will automatically change the values in the table and other visualizations.
Filters
Updated over 1 year ago
