Monitor Cloud Connectors Health
You can use the Cloud Connectors Health Dashboard to review statistical information on the health of the cloud connectors.
To access and view the Cloud Connectors Health Dashboard:
- Log in to TDP using an Administrator user account.
- In the Tetra Data Platform, click the Hamburger icon at the top left corner of the page to expand the TDP menu options (or hover over the list of icons to display the menu options).
- Select Health Monitoring from the list of menu options that appears on the left side of the page.
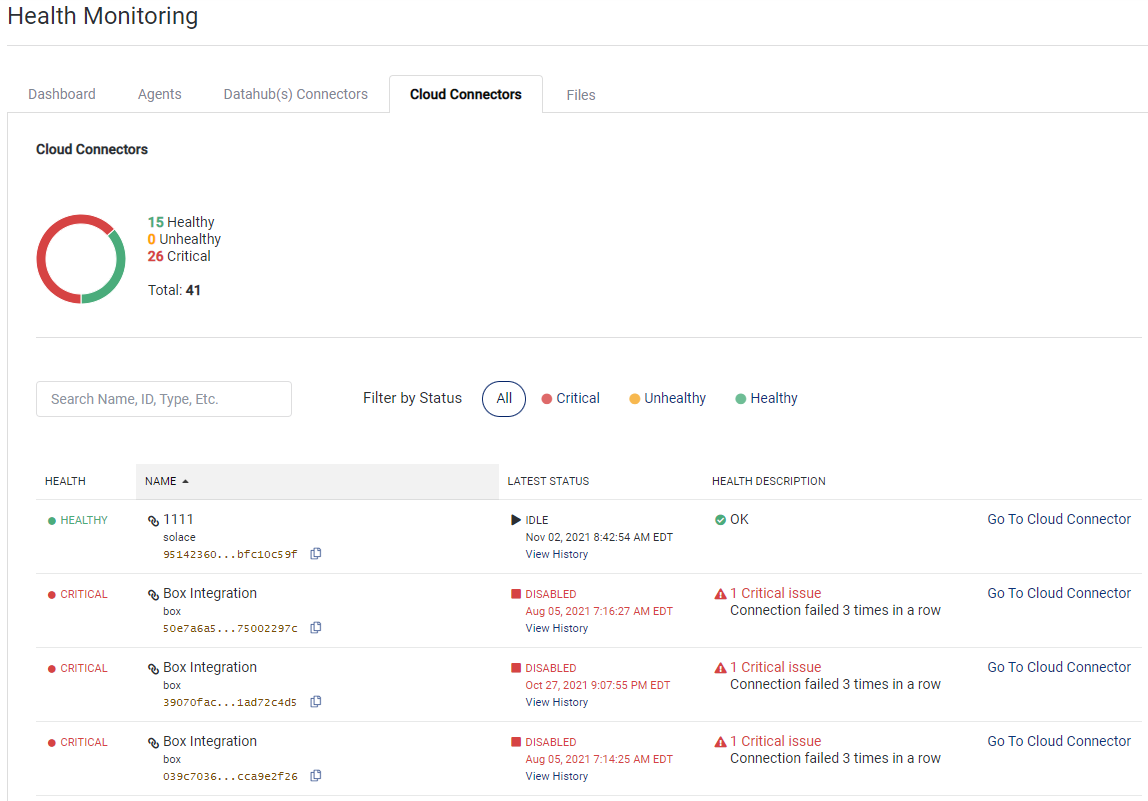
- From the Health Monitoring screen, click the Cloud Connectors tab to view the Cloud Connectors Health Dashboard:

Cloud Connectors Health Dashboard
The aggregate status of Healthy, Unhealthy, and Critical cloud connectors display as a graphic at the top of the page. A cloud connector may exist in these possible states:
| State | Event |
|---|---|
| Healthy | A Cloud Connector is in a Healthy state when: - Online: The last status received was 3 or less minutes ago. - Environment: Percentage of memory used is less than or equal to 80%. |
| Unhealthy | A Cloud Connector is in an Unhealthy state when: Idle integrations have a waiting time of 5 times the polling interval and/or active integrations have a processing time that matches the polling interval. |
| Critical | A Cloud Connector is in a Critical state when: - Connection: A connection cannot be made after 3 consecutive attempts. - Waiting/Processing Time: When the idle integrations have a waiting time of more than 5 times the polling interval and/or active integrations have a processing time that exceeds the polling interval. |
- To search for a component name, you can enter all (or a portion) of the Cloud Connector name or unique identifier (UID) in the Search box.
- To apply a filter by status, you can also select All, Critical, Unhealthy, or Healthy next to the Search box.
This table describes the health details for the individual Cloud Connector:
| Field | Description |
|---|---|
| Health | Displays the status for the Cloud Connector. By default, all status types display on this dashboard. |
| Name | Name (and representative icon) of the Cloud Connector. To copy the unique ID for the component instance, you can click the copy file icon. |
| Latest Status | When the latest status (Date/Time format) was assigned, and whether its currently Idle or has been Disabled. To review a component's status history, click the View History link below the status. |
| Health Description | Explains why the component has been assigned the critical state. By default, only one issue is shown. If there is more than one issue, then a link displays (for example, +1 More) indicating there are additional issues to review. |
| Go To Cloud Connector | Provides a link you can click to review the configuration details for the particular Cloud Connector. |
Updated over 1 year ago
