Monitor Cloud Connectors Health
The Cloud Connectors Health Monitoring Dashboard provides statistical information on the health of the cloud connectors you've configured in your Tetra Data Platform (TDP) environment.
Access the Cloud Connectors Health Dashboard
To view the Cloud Connectors Health Monitoring Dashboard, do the following:
- Sign in to the TDP as a user with an Administrator role.
- In the left navigation menu, choose Operational Intelligence (menu option displays as Health Monitoring in TDP v4.4.0 and earlier). Then, select Health Monitoring.
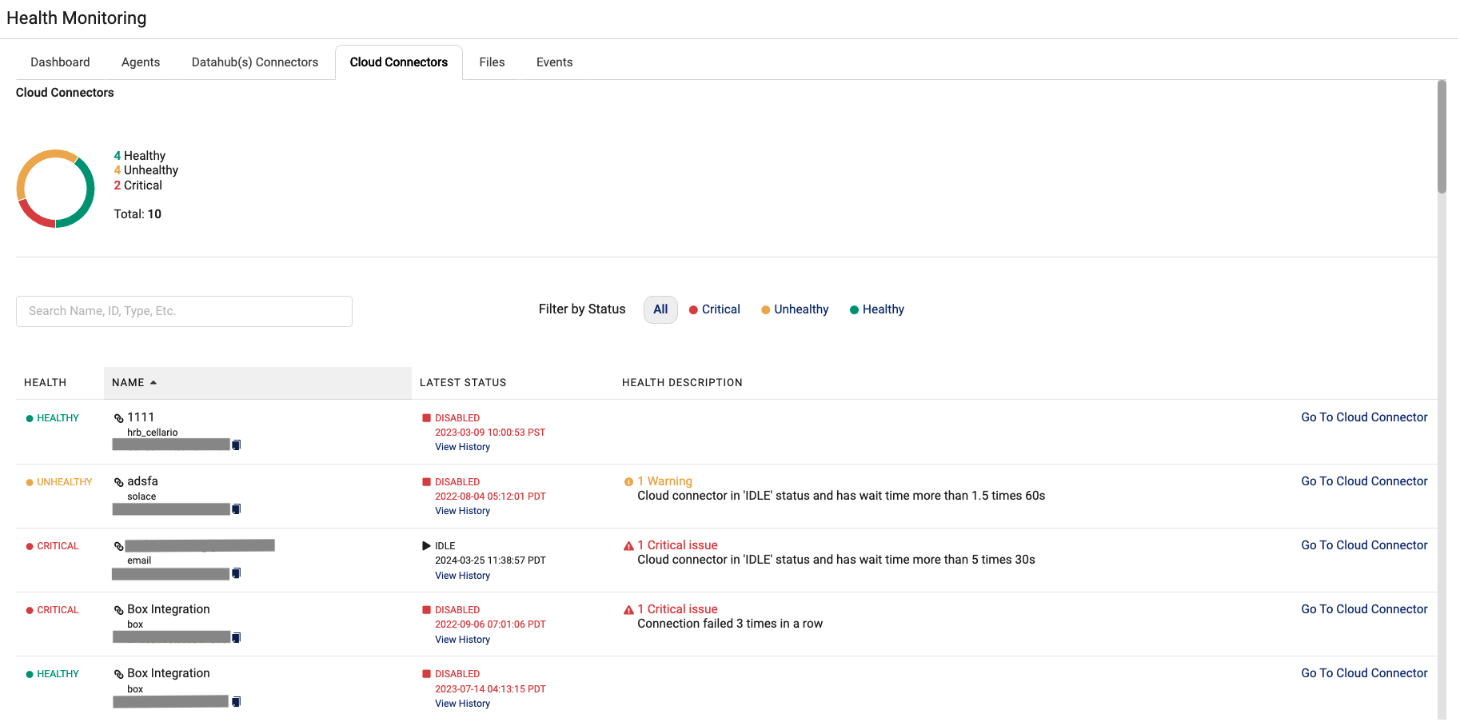
- From the Health Monitoring Dashboard, select the Cloud Connectors tab to view the Cloud Connectors Health Monitoring Dashboard.
NOTETo search for a component name, you can enter all (or a portion) of the Cloud Connector name or unique identifier (UID) in the Search box. To apply a filter by status, you can also select All, Critical, Unhealthy, or Healthy next to the Search box.
Cloud Connector Status
The aggregate status of Healthy, Unhealthy, and Critical cloud connectors display as a graphic at the top of the page.
A cloud connector can have any of the following statuses:
| State | Event |
|---|---|
| Healthy | A Cloud Connector is in a Healthy state when:
|
| Unhealthy | A Cloud Connector is in an Unhealthy state when: Idle integrations have a waiting time of 5 times the polling interval and/or active integrations have a processing time that matches the polling interval. |
| Critical | A Cloud Connector is in a Critical state when:
|
Cloud Connector Details
The following table describes the health details provided for each Cloud Connector:
| Field | Description |
|---|---|
| Health | Displays the status for the Cloud Connector. By default, all status types display on this dashboard. |
| Name | Name (and representative icon) of the Cloud Connector. To copy the unique ID for the component instance, you can click the copy file icon. |
| Latest Status | When the latest status (Date/Time format) was assigned, and whether its currently Idle or has been Disabled. To review a component's status history, click the View History link below the status. |
| Health Description | Explains why the component has been assigned the critical state. By default, only one issue is shown. If there is more than one issue, then a link displays (for example, +1 More) indicating there are additional issues to review. |
| Go To Cloud Connector | Provides a link you can click to review the configuration details for the particular Cloud Connector. |
Documentation Feedback
Do you have questions about our documentation or suggestions for how we can improve it? Start a discussion in TetraConnect Hub. For access, see Access the TetraConnect Hub.
NOTEFeedback isn't part of the official TetraScience product documentation. TetraScience doesn't warrant or make any guarantees about the feedback provided, including its accuracy, relevance, or reliability. All feedback is subject to the terms set forth in the TetraConnect Hub Community Guidelines.
Updated 2 months ago