Health Monitoring App v1.x Release Notes
The following are the Health Monitoring App release notes for versions 1.x. Starting in version 1.1.0, the Health Monitoring App provides two comprehensive dashboards in the Tetra Data Platform (TDP) user interface to help customers gain an end-to-end understanding of data usage and downtime as well as platform usage:
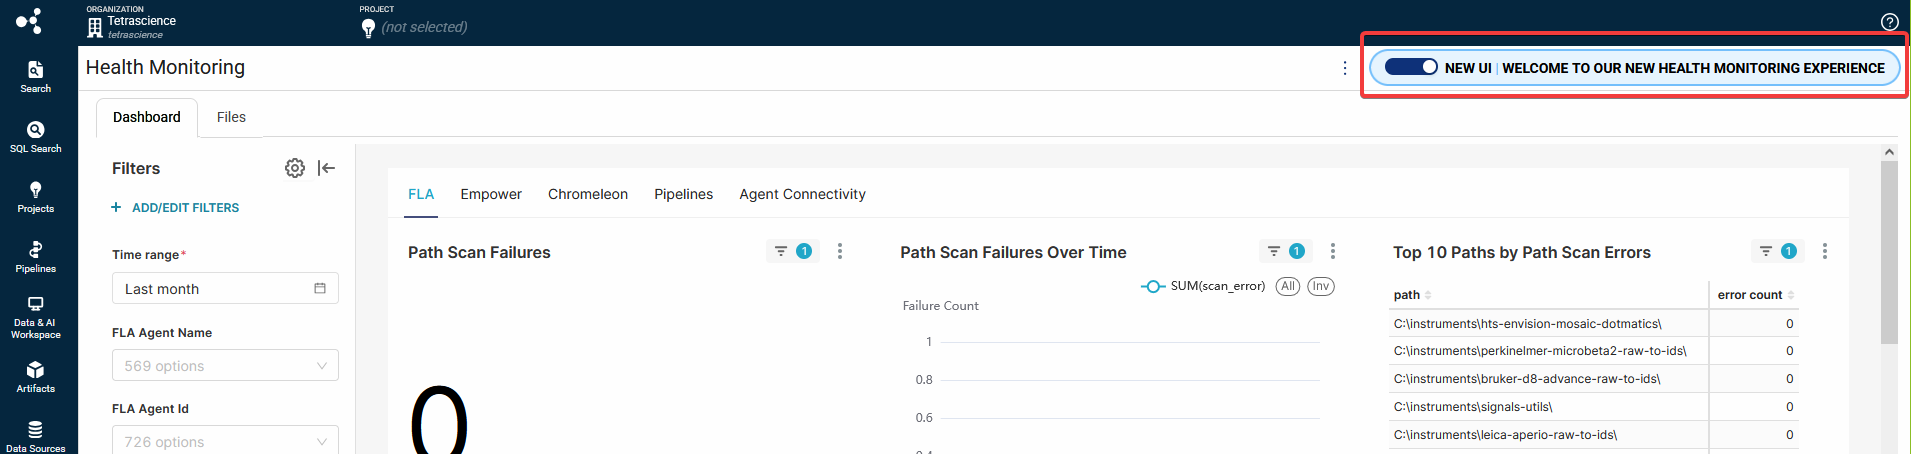
- Health Monitoring provides metrics for ingestion failures and latency for on-premises Tetra File-Log Agents, Tetra Chromeleon Agents, and Tetra Data Pipelines.
- Operational Insights provides metrics for data volume and flow as well as user activity and engagement.
NOTEHealth Monitoring App v1.0.0 and earlier includes only the Health Monitoring dashboard, not the Operational Insights dashboard.
v1.1.0
Release date: 22 December 2025
What's New
TetraScience has released its next version of the Health Monitoring App, version 1.1.0. This release introduces a new Operational Insights dashboard in the TDP user interface that provides metrics for data volume and flow as well as user activity and engagement.
Prerequisites
Health Monitoring App v1.1.0 requires the following:
- Tetra Data Platform (TDP) v4.4.0 or higher
- Customers must contact TetraScience to have the app activated in their TDP environment
For Customer-Hosted TDP Environments Only
- The TetraScience Databricks integration (which supports the Lakehouse). Contact your customer account leader to set this up.
New Functionality
New Functionality includes features not previously available in the Health Monitoring App.
Operational Insights Dasbhoard
A new Operational Insights dashboard in the TDP user interface provides metrics for data volume and flow as well as user activity and engagement.
The new dashboard includes two tabs:
Data Volume & Flow
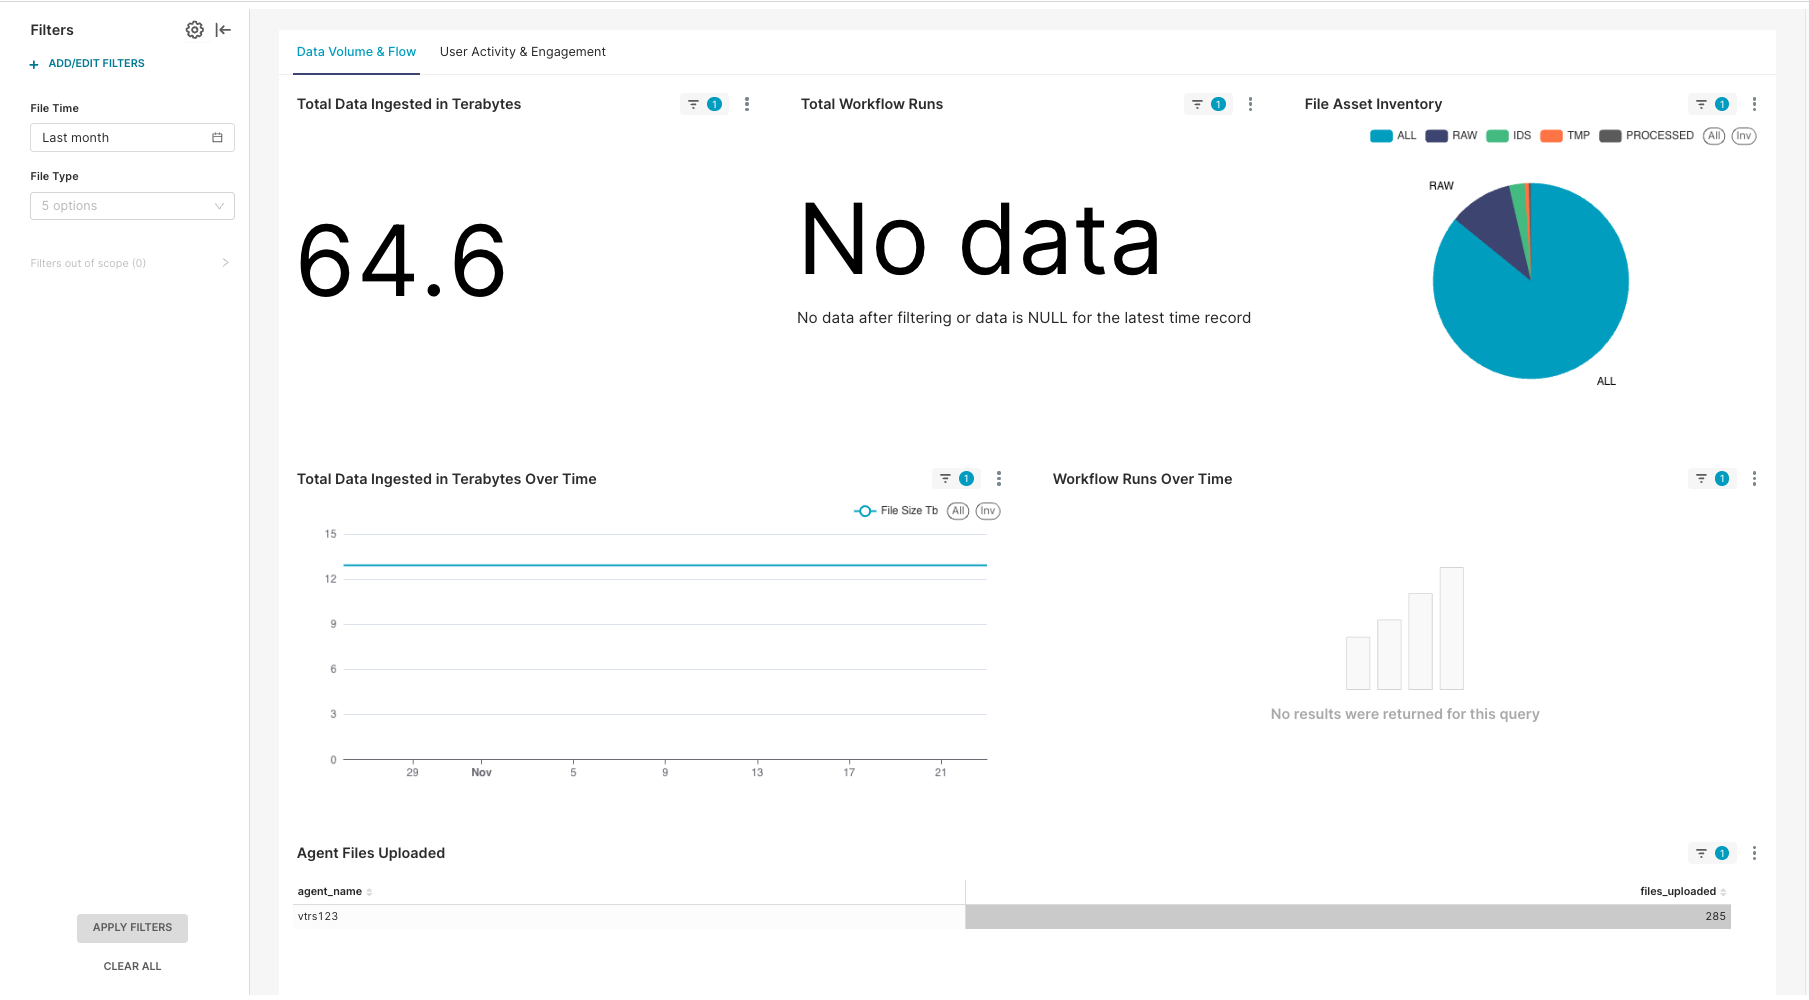
The Data Volume & Flow tab displays the following metrics:
| Performance Metric | Metric Type | Description |
|---|---|---|
| Total Data Ingested in Terabytes | KPI | Total data ingested in terabytes |
| Total Workflow Runs | KPI | Total number of workflow runs |
| File Asset Inventory | Chart | Total number of files by type |
| Total Data Ingested Over Time | Chart | Total data ingested over time |
| Total Workflow Runs Over Time | Chart | Total workflow runs over time |
| Agent Files Uploaded | Table | Total number of files uploaded by agents |
Available Data Volume & Flow Tab Filters
You can filter the Data Volume & Flow tab data using the following options:
- Time Range: Select a predefined time range or set a custom date range.
- File Type: Filter by specific type of file, such as
RAW,IDS,PROCESSED, orTMP. This list is dynamically populated by the existing data. So you might only see some of these labels if you don't have files of a specific type.
User Activity & Engagement
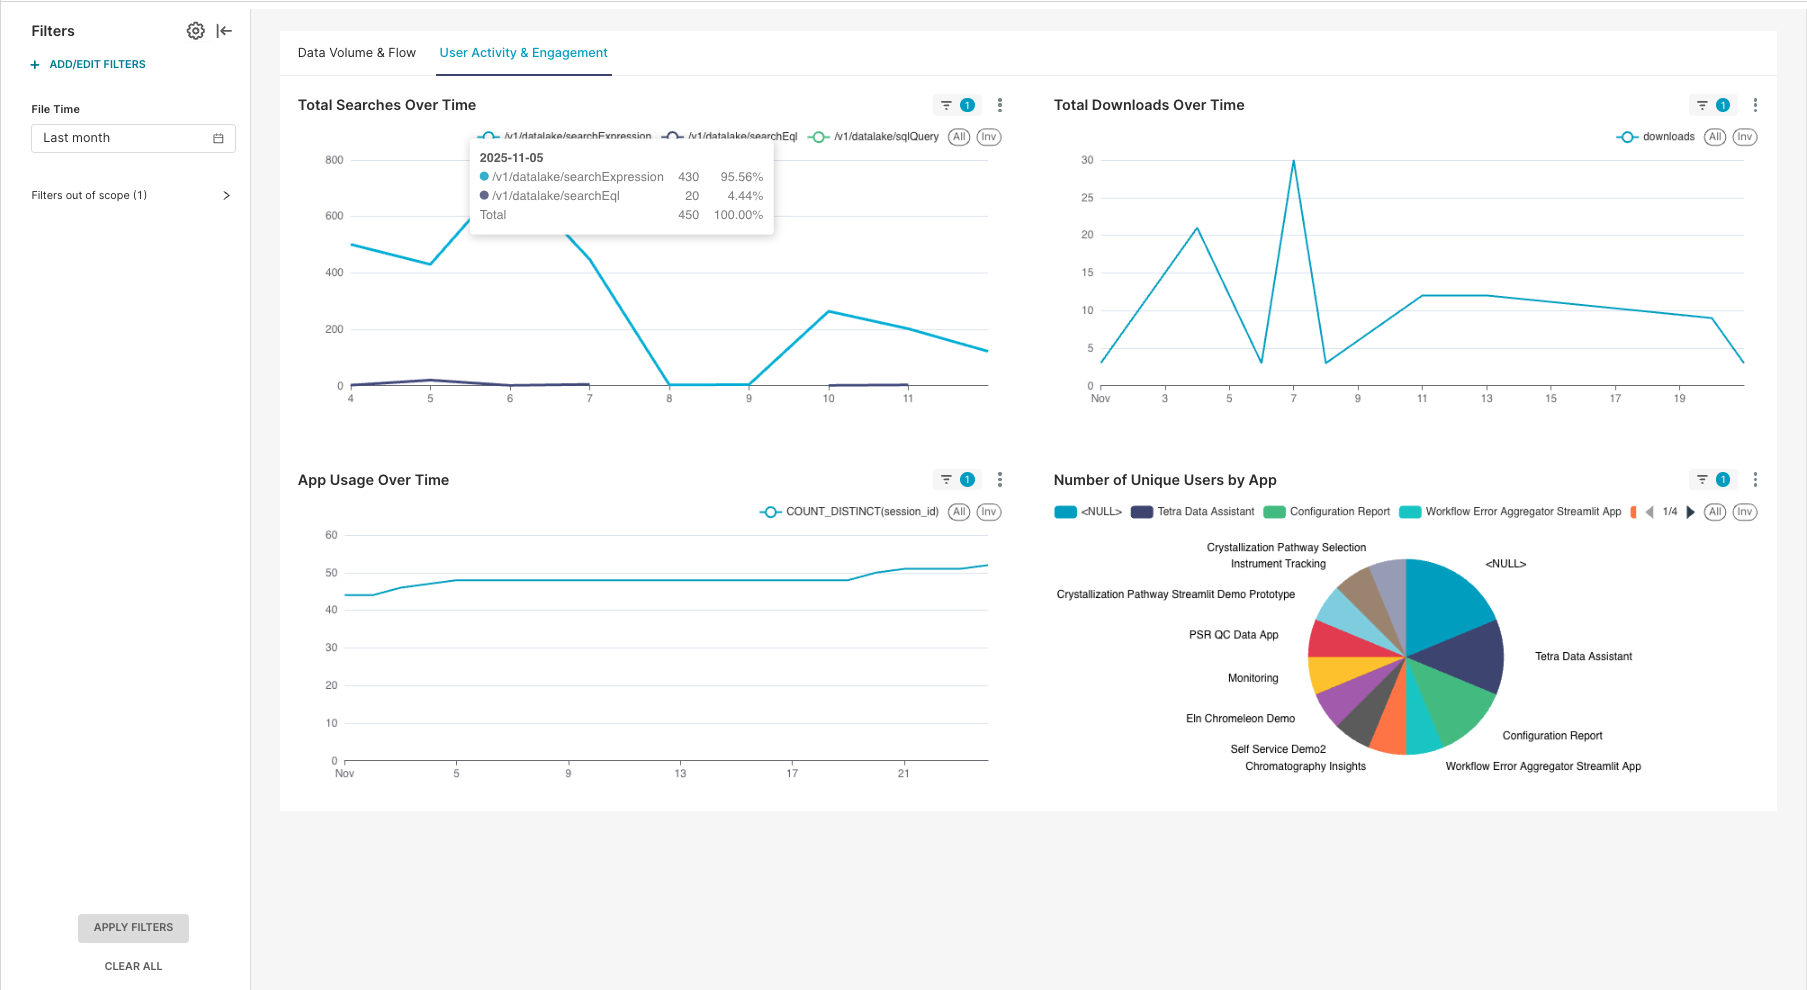
The User Activity & Engagement tab displays the following metrics:
| Performance Metric | Metric Type | Description |
|---|---|---|
| Total Searches Over Time | Chart | Total number of searches over time |
| Total Downloads Over Time | Chart | Total number of downloads over time |
| Total App Usage Over Time | Chart | Total number of unique app sessions over time |
| Count of App Users Per App | Chart | Total number of unique app users per app |
Available User Activity & Engagement Tab Filters
You can filter the User Activity & Engagement tab data using the following options:
- Time Range: Select a predefined time range or set a custom date range.
For more information, see Operational Insights.
Enhancements
Enhancements are modifications to existing functionality that improve performance or usability, but don't alter the function or intended use of the system.
- There are no enhancements in this release.
Bug Fixes
There are no bug fixes in this release.
Limitations
The following are known limitations of Health Monitoring App v1.1.0:
- Metrics data for the Operational Insights dashboard is backfilled with data from July 2025 and later only when the app is activated. However, it can take several days for the data to backfill (one month of data takes about a day to populate). Until the data backfill completes, only the latest data captured from when the app is updated appears in the dashboard.
- Metrics data for the Health Monitoring App dashboard isn't backfilled when the app is activated, so the available data spans one day in duration only when the new Health Monitoring dashboard first appears in customers' TDP environments.
- If the available data spans one day in duration only (for example, when the new dashboard is first activated) then charts in the new Health Monitoring dashboard will appear empty. If customers hover their cursors over an empty chart, they will see a single data point, which is a summary statistic for that day. Once customers have two days of data available, then the charts and tables will populate as normal.
- The File Ingestion Journey chart on the FLA tab won't show any file search indexing events or other downstream file events if those events occur outside of the Time range filter defined by customers. This behavior occurs because all File Ingestion Journey events are a subset of the original files that were scanned during the specified time range.
- There is a maximum number of table rows available for each of the following troubleshooting metrics:
- Last Agent Heartbeat: 100 row maximum
- File Status: 1,000 row maximum
- Workflow Status: 1,000 row maximum
- Path Status (Latest Scan): 1,000 row maximum
Deprecated Features
There are no new deprecated features in this release. For more information about TDP deprecations, see Tetra Product Deprecation Notices.
Known and Possible Issues
Last updated: 27 February 2026
The following are known issues for Health Monitoring App v1.1.0:
- Downgrading from Health Monitoring App v1.1.0 to v1.0.0 may result in the Operational Insights dashboard being displayed in the Health Monitoring view instead of the Health Monitoring dashboard. TetraScience recommends not downgrading from v1.1.0 since v1.1.0 did not introduce changes to the Health Monitoring dashboard. If customers need to downgrade, they should contact TetraScience for assistance. (Added on 27 February 2026)
- When customers upgrade to Health Monitoring App v1.1.0 from v1.0.0 and select Change Version, a
404error page might display until the installation dialog appears. After the new app version is installed, the404page disappears and the app's dashboards load. A fix for this issue is in development and testing and is scheduled for a future Tetra Data Platform (TDP) release. - After being activated, the Health Monitoring App may return a
500internal server error as it establishes a new user database. To resolve the issue, customers should log out of the TDP, close their web browser, and then reopen the browser and sign back in to the TDP. - After selecting Enter fullscreen on a graph, the graph can sometimes fail to render and an error appears. To resolve the issue, navigate back to the dashboard and re-enter the fullscreen view.
- The app might also display a Workgroup Not Found error when opened for the first time. To resolve the issue, customers must rotate their organization-level SQL Credentials. Keep in mind, the new set of generated credentials will cause the previous set of credentials to stop working.
Security
The Health Monitoring App implements the following security measures:
- All dashboard data is encrypted in transit using TLS 1.2+
- Access to metrics is controlled through TDP's role-based access control system
- Audit logging tracks all dashboard configuration changes
- Alert configurations are encrypted at rest
Upgrade Considerations
To upgrade to Health Monitoring App v1.1.0, TDP v4.4.0 or higher is required.
When activating the Health Monitoring App, keep in mind the following:
- After being activated, the app may return a
500internal server error as it establishes a new user database. To resolve the issue, customers should log out of the TDP, close their web browser, and then reopen the browser and sign back in to the TDP. - The app might also display a Workgroup Not Found error when opened for the first time. To resolve the issue, customers must rotate their organization-level SQL Credentials. Keep in mind, the new set of generated credentials will cause the previous set of credentials to stop working.
- The app can be deactivated at any time, if needed.
(For customer-hosted deployments only) Activating the Health Monitoring App introduces additional data processing costs in the Data Lakehouse. To process integration events in near real time, the app creates its own silver Lakehouse Tables that are required for data cleaning and validation. These tables support the analytics displayed in the Health Monitoring App and are activated through a feature flag (enable_dam_silver_tables), which can be turned off at any time. For a cost estimate based on your specific needs, contact your customer account leader. (Updated on 14 November 2025)
For more information about the Health Monitoring App, see Health Monitoring App.
v1.0.0
Release date: 30 June 2025
What's New
TetraScience has released its first general availability (GA) version of the Health Monitoring App (previously known as the Superset Monitoring App), version 1.0.0. This release introduces persistence for Superset metadata, including charts, dashboards, and authentication sessions. It also introduces several new graphs for Empower and a new Chromeleon tab.
Prerequisites
Last updated: 18 August 2025
Health Monitoring App v1.0.0 requires the following:
- Tetra Data Platform (TDP) v4.3.0 or higher
- An activated Data Lakehouse Architecture
- Customers must contact TetraScience to have the app activated in their TDP environment
For Customer-Hosted TDP Environments Only
- The TetraScience Databricks integration (which supports the Lakehouse). Contact your customer account leader to set this up.
New Functionality
New Functionality includes features not previously available in the Health Monitoring App.
- Superset metadata persistence: Any changes made to the app configuration now persist between user sessions, and when customers upgrade to the latest app version.
Enhancements
Enhancements are modifications to existing functionality that improve performance or usability, but don't alter the function or intended use of the system.
- New Empower charts were added for latency, top injections, and projects.
- An Agent Name field was added to charts relating to Agents, and users can now filter by Agent name.
- A new tab for Tetra Chromeleon Agents was added.
Bug Fixes
The following bugs are now fixed:
- User cookies are now persisted, which solves intermittent 500 internal server errors when the app is activated. However, a
500error may still be seen when upgrading to the latest app version. To resolve the issue, customers should log out of the TDP, close their web browser, and then reopen the browser and sign back in to the TDP.
Limitations
The following are known limitations of Health Monitoring App v1.0.0:
- Metrics data isn't backfilled when the app is activated, so the available data spans one day in duration only when the new Health Monitoring dashboard first appears in customers' TDP environments.
- If the available data spans one day in duration only (for example, when the new dashboard is first activated) then charts in the new Health Monitoring dashboard will appear empty. If customers hover their cursors over an empty chart, they will see a single data point, which is a summary statistic for that day. Once customers have two days of data available, then the charts and tables will populate as normal.
- The File Ingestion Journey chart on the FLA tab won't show any file search indexing events or other downstream file events if those events occur outside of the Time range filter defined by customers. This behavior occurs because all File Ingestion Journey events are a subset of the original files that were scanned during the specified time range.
- There is a maximum number of table rows available for each of the following troubleshooting metrics:
- Last Agent Heartbeat: 100 row maximum
- File Status: 1,000 row maximum
- Workflow Status: 1,000 row maximum
- Path Status (Latest Scan): 1,000 row maximum
Deprecated Features
There are no new deprecated features in this release. For more information about TDP deprecations, see Tetra Product Deprecation Notices.
Known and Possible Issues
The following are known issues for Health Monitoring App v1.0.0:
- After being activated, the Health Monitoring App may return a
500internal server error as it establishes a new user database. To resolve the issue, customers should log out of the TDP, close their web browser, and then reopen the browser and sign back in to the TDP. - After selecting Enter fullscreen on a graph, the graph can sometimes fail to render and an error appears. To resolve the issue, navigate back to the dashboard and re-enter the fullscreen view.
Security
The Health Monitoring App implements the following security measures:
- All dashboard data is encrypted in transit using TLS 1.2+
- Access to metrics is controlled through TDP's role-based access control system
- Audit logging tracks all dashboard configuration changes
- Alert configurations are encrypted at rest
Upgrade Considerations
Last updated: 14 November 2025
When activating the Health Monitoring App, keep in mind the following:
- After being activated, the app may return a
500internal server error as it establishes a new user database. To resolve the issue, customers should log out of the TDP, close their web browser, and then reopen the browser and sign back in to the TDP. - The app might also display a Workgroup Not Found error when opened for the first time. To resolve the issue, customers must rotate their organization-level SQL Credentials. Keep in mind, the new set of generated credentials will cause the previous set of credentials to stop working.
- The app can be deactivated at any time, if needed. (Updated on 14 November 2025)
(For customer-hosted deployments only) Activating the Health Monitoring App introduces additional data processing costs in the Data Lakehouse. To process integration events in near real time, the app creates its own silver Lakehouse Tables that are required for data cleaning and validation. These tables support the analytics displayed in the Health Monitoring App and are activated through a feature flag (enable_dam_silver_tables), which can be turned off at any time. For a cost estimate based on your specific needs, contact your customer account leader. (Updated on 14 November 2025)
For more information about the Health Monitoring App, see Health Monitoring App.
Other Release Notes
To view previous release notes for the Superset Monitoring App (EAP versions), see Superset Monitoring App EAP Release Notes.
To view other release notes for Tetra Data Apps, see Tetra Data Apps Release Notes.
Updated 2 months ago