Operational Insights
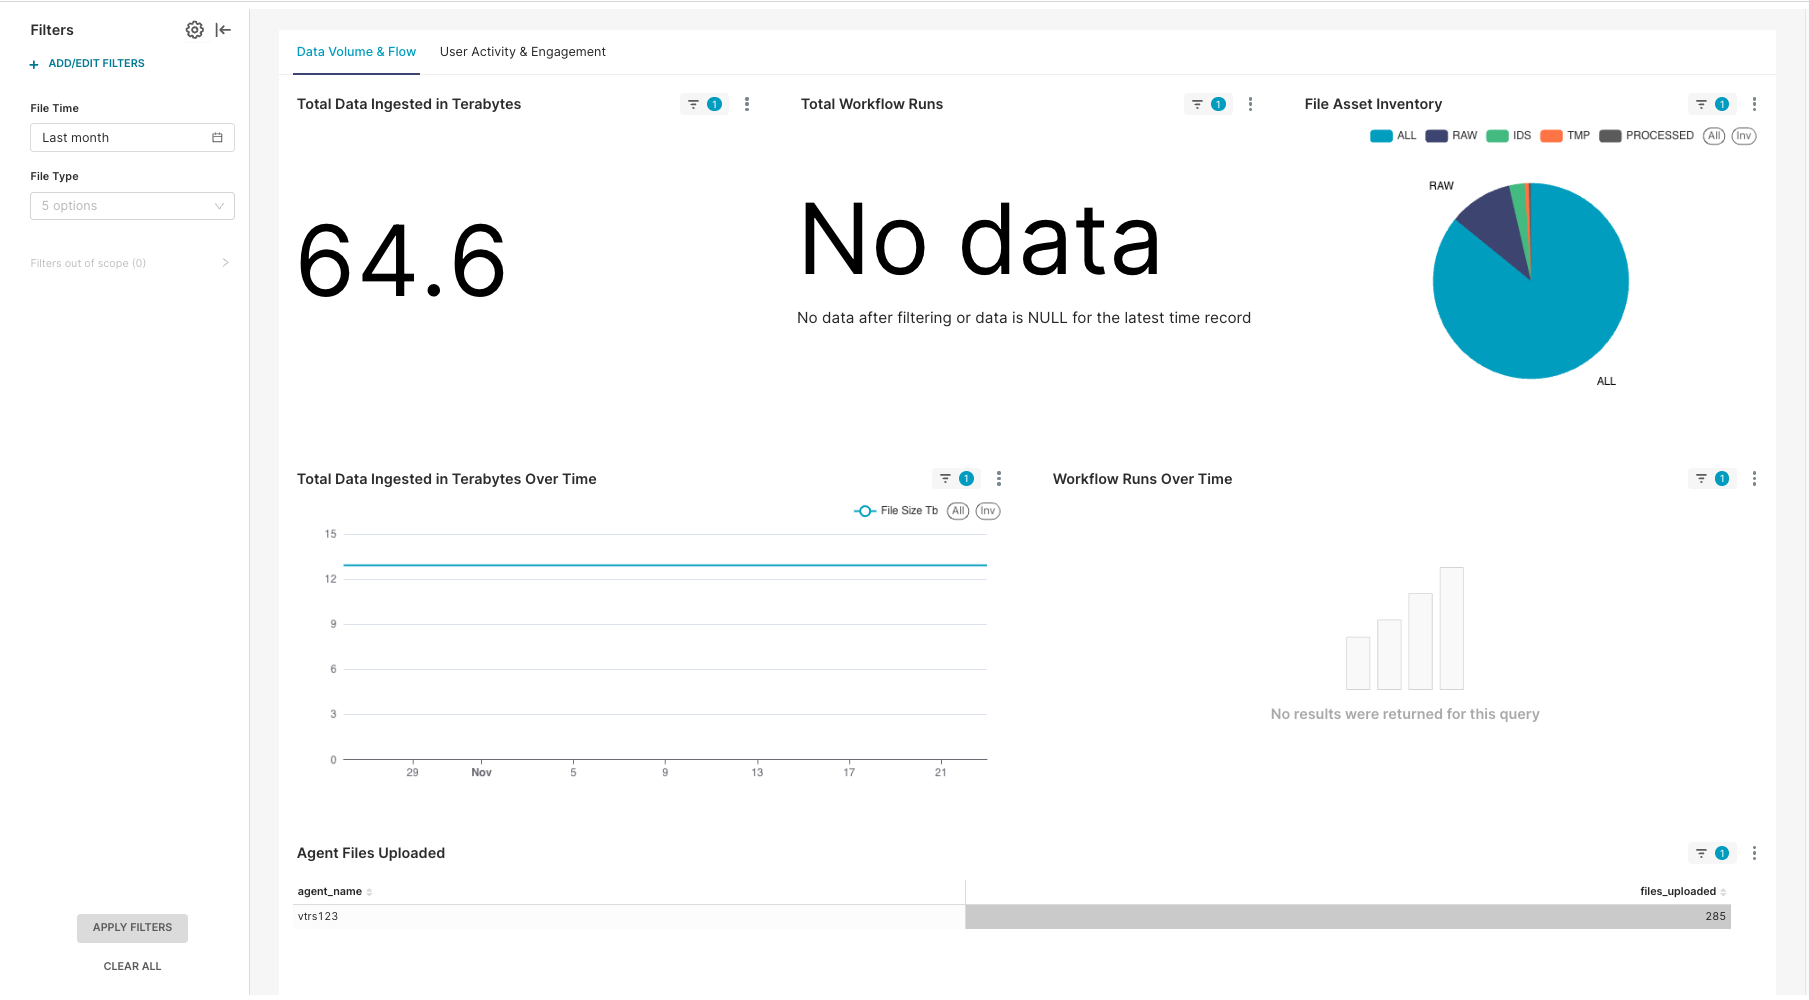
The Operational Insights dashboard, which is activated through the Health Monitoring App, provides metrics for data volume and flow as well as user activity and engagement in the Tetra Data Platform (TDP).
NOTETo help you proactively monitor your data sources, you can also activate the optional Alert Management page and configure email notifications for offline integrations.
Prerequisites
- For Operational Insights v2.0.x: TDP v4.5.0 or later with Health Monitoring App v2.0.0 or later
- For Operational Insights v1.x: TDP v4.3.0 through TDP v4.5.0 with Health Monitoring App v1.x
NOTEIn TDP v4.5.0 and later, the Operational Insights menu option now displays for all customers by default, whether or not the Health Monitoring App is installed and activated in their TDP environment. Previously, the Operational Insights dashboard required the Health Monitoring App to be manually activated by a customer account leader.
For the Operational Insights dashboard to appear and populate with usage data, either a user with Administrator permissions must choose to enable the dashboard in the UI after selecting the Operational Insights menu option, or customers must have the Health Monitoring App activated in their TDP environment. If the app isn't activated or the Operational Insights dashboard isn't enabled through the UI by and admin, then customers will see a prompt to either enable the dashboard if they're an admin, or to contact their admin to enable it if they're a non-admin user.
Enabling the Operational Insights dashboard through the UI installs the Health Monitoring App and activates the Operational Insights dashboard only. It doesn't activate the Health Monitoring App dashboard, which must still be done in coordination with TetraScience.
User Guides
Select the user guide that corresponds to the version of the Health Monitoring App activated in your TDP environment:
- Operational Insights User Guide (v2.0.x) — For Health Monitoring App v2.0.0 and later
- Operational Insights User Guide (v1.x) — For Health Monitoring App v1.1.0 and earlier
IMPORTANTUpgrading to Health Monitoring App v2.0.0 or later is recommended after upgrading to TDP v4.5.0 or later for improved functionality and will be required starting in TDP v4.6.0. For more information, see the Health Monitoring App v1.1.0 and Earlier Deprecation Notice.
Documentation Feedback
Do you have questions about our documentation or suggestions for how we can improve it? Start a discussion in TetraConnect Hub. For access, see Access the TetraConnect Hub.
NOTEFeedback isn't part of the official TetraScience product documentation. TetraScience doesn't warrant or make any guarantees about the feedback provided, including its accuracy, relevance, or reliability. All feedback is subject to the terms set forth in the TetraConnect Hub Community Guidelines.
Updated 3 months ago