Operational Insights User Guide (v1.x)
User guide for Operational Insights dashboard versions 1.x
This guide explains how to use Operational Insights versions 1.x to monitor data volume, flow, and user activity in the Tetra Data Platform (TDP).
To activate the Operational Insights dashboard, activate the Health Monitoring App in your TDP environment.
IMPORTANTUpgrading to Health Monitoring App v2.0.0 or later is recommended after upgrading to TDP v4.5.0 or later for improved functionality and will be required starting in TDP v4.6.0. For more information, see the Health Monitoring App v1.1.0 and Earlier Deprecation Notice.
Access the Operational Insights Dashboard
To access the Operational Insights dashboard, do the following:
- Sign in to the TDP as a user with an Administrator role.
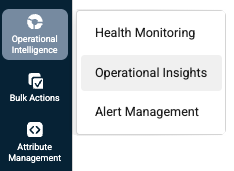
- In the left navigation menu, choose Operational Intelligence. Then, select Operational Insights.
Operational Insights Metrics
The Operational Insights dashboard is organized into two tabs, each focusing on different aspects of your TDP operations:
- Data Volume & Flow: provides metrics on total data ingested, total workflow runs, and file asset inventory
- User Activity & Engagement: provides metrics on total searches and Data App usage
Each tab provides a set of visualizations, filters, and tables to help you monitor and optimize your TDP operations.
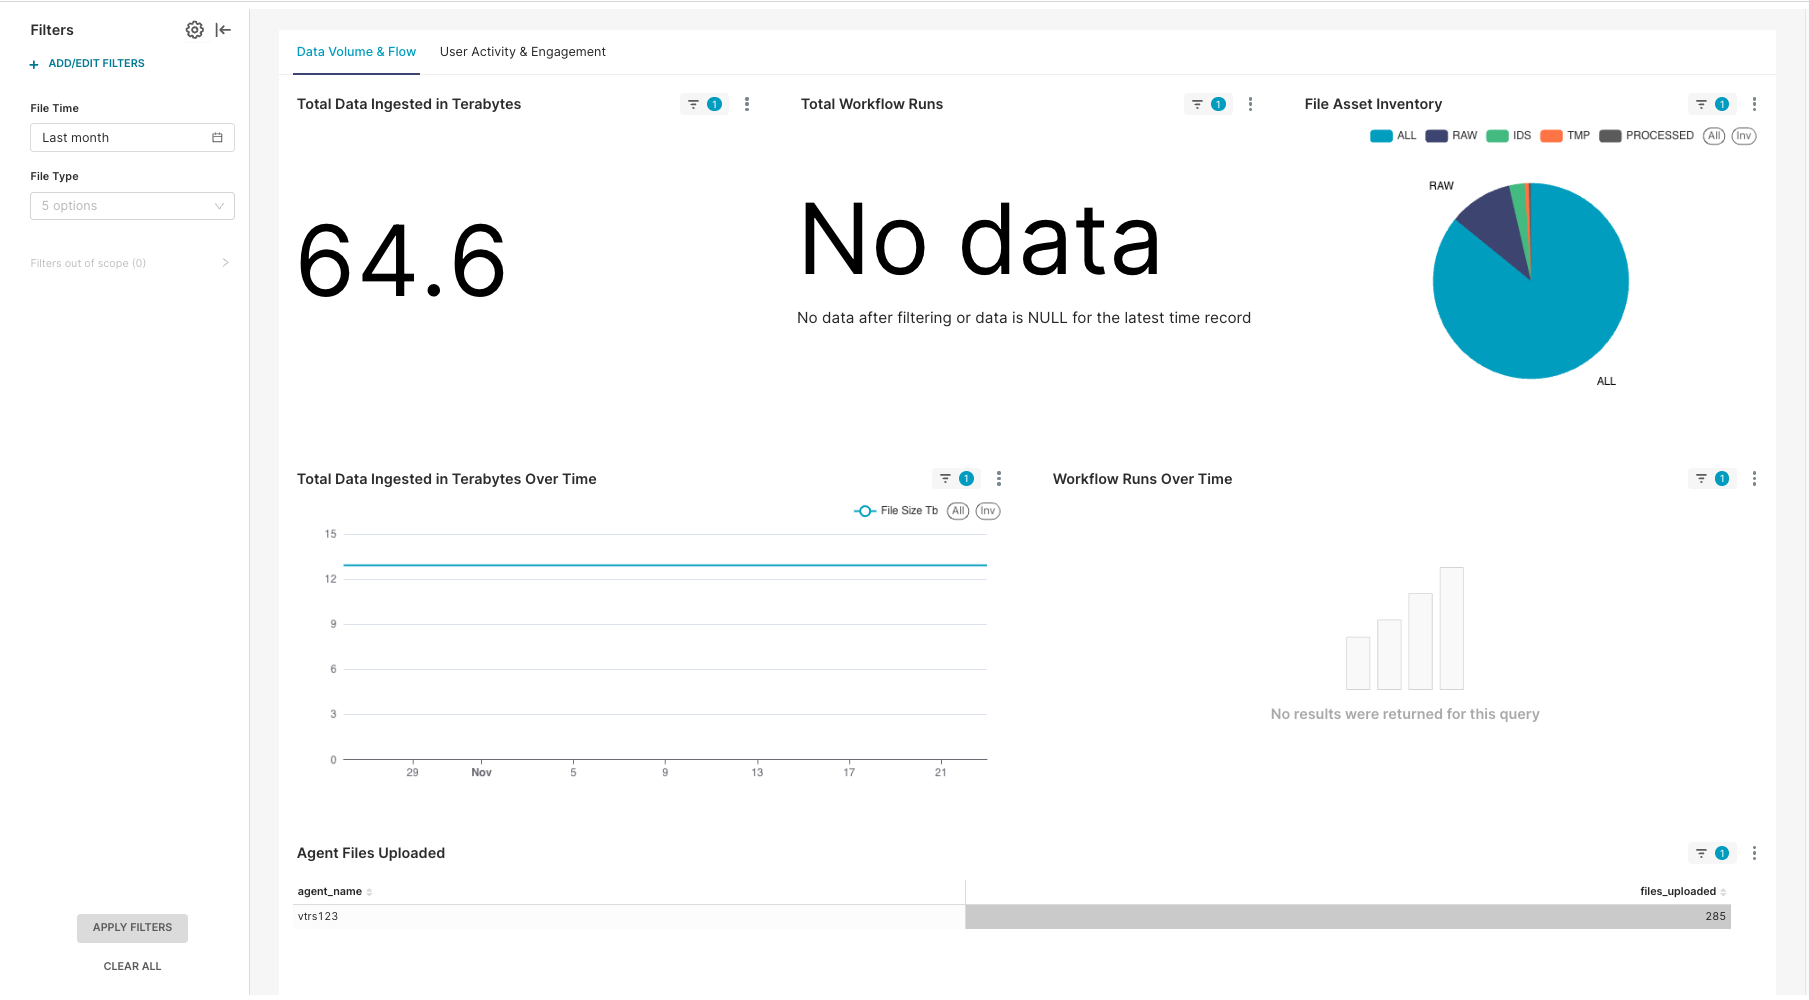
Data Volume & Flow Tab
The Data Volume & Flow tab provides metrics on total data ingested, total workflow runs, and file asset inventory.
Data Volume & Flow Tab Metrics
The Data Volume & Flow tab displays the following metrics:
| Performance Metric | Metric Type | Description |
|---|---|---|
| Total Data Ingested in Terabytes | KPI | Total data ingested in terabytes |
| Total Workflow Runs | KPI | Total number of workflow runs |
| File Asset Inventory | Chart | Total number of files by type |
| Total Data Ingested Over Time | Chart | Total data ingested over time |
| Total Workflow Runs Over Time | Chart | Total workflow runs over time |
| Agent Files Uploaded | Table | Total number of files uploaded by agents |
Available Data Volume & Flow Tab Filters
You can filter the Data Volume & Flow tab data using the following options:
- Time Range: Select a predefined time range or set a custom date range
- File Type: Filter by specific type of file, such as
RAW,IDS,PROCESSED, orTMP. This list is dynamically populated by the existing data. So you might only see some of these labels if you don't have files of a specific type.
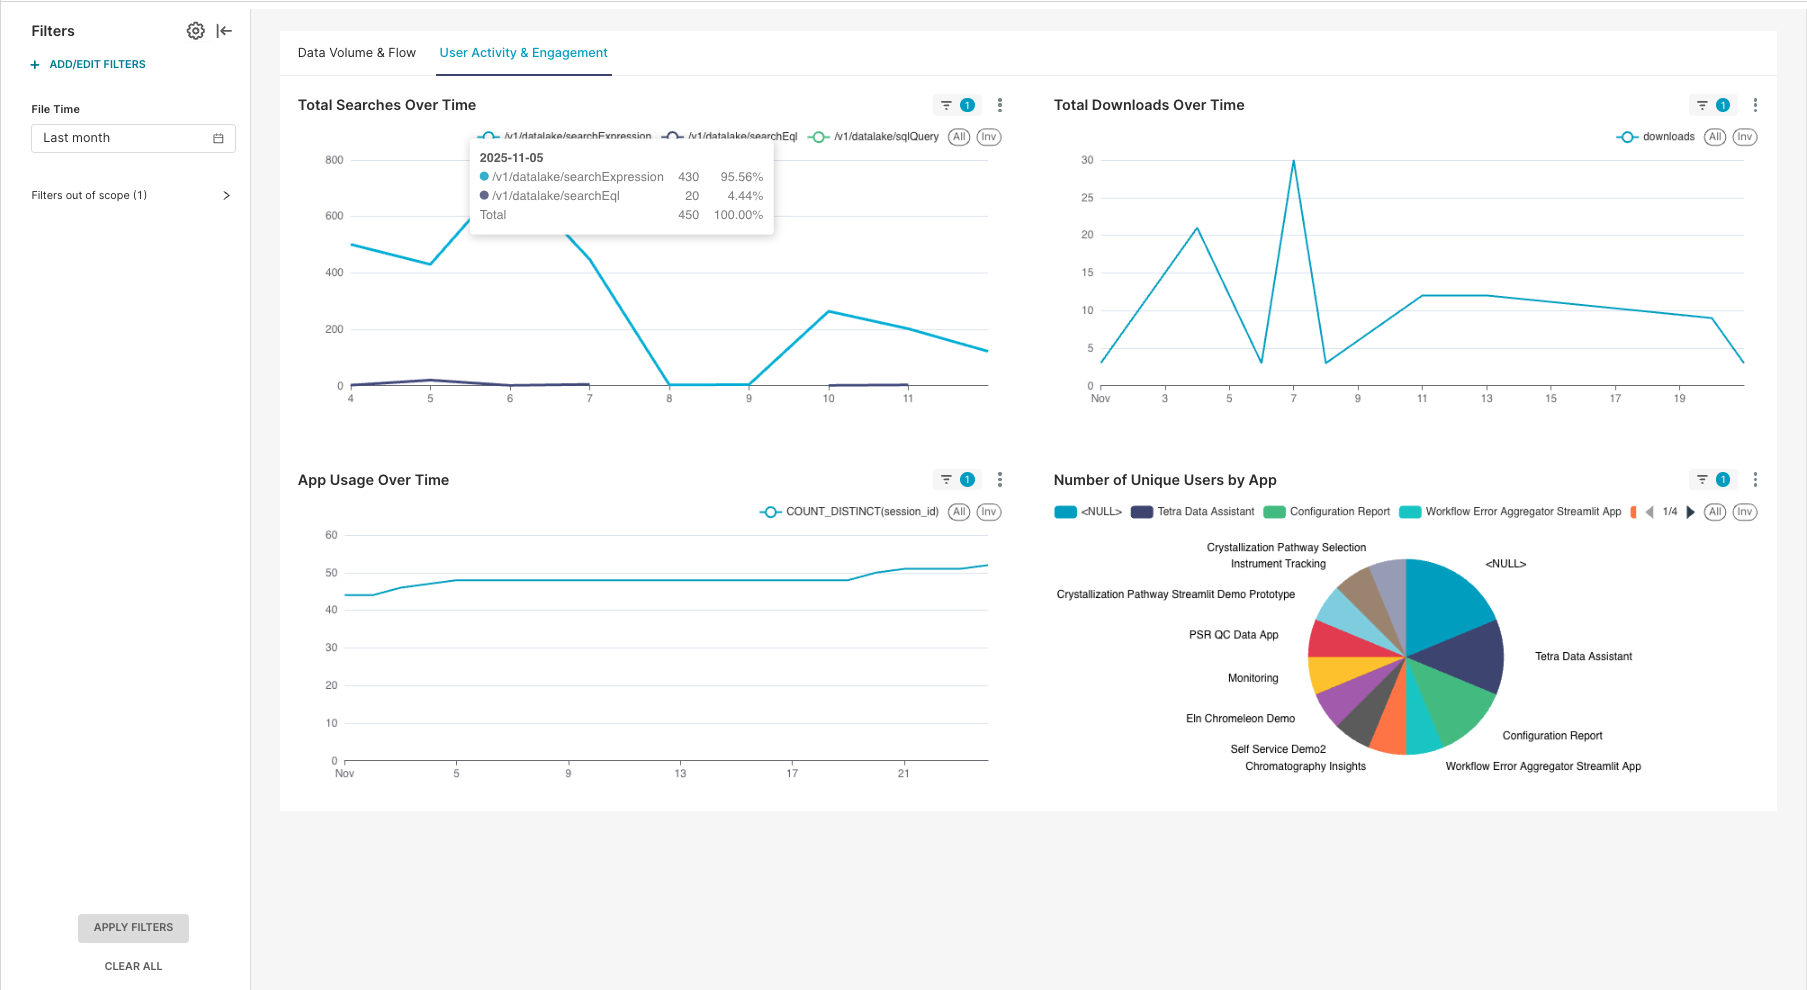
User Activity & Engagement Tab
The User Activity & Engagement tab provides metrics on total searches and Data App usage.
User Activity & Engagement Tab Metrics
The User Activity & Engagement tab displays the following metrics:
| Performance Metric | Metric Type | Description |
|---|---|---|
| Total Searches Over Time | Chart | Total number of searches over time |
| Total Downloads Over Time | Chart | Total number of downloads over time |
| Total App Usage Over Time | Chart | Total number of unique app sessions over time |
| Count of App Users Per App | Chart | Total number of unique app users per app |
Available User Activity & Engagement Tab Filters
You can filter the User Activity & Engagement tab data using the following options:
- Time Range: Select a predefined time range or set a custom date range.
Documentation Feedback
Do you have questions about our documentation or suggestions for how we can improve it? Start a discussion in TetraConnect Hub. For access, see Access the TetraConnect Hub.
NOTEFeedback isn't part of the official TetraScience product documentation. TetraScience doesn't warrant or make any guarantees about the feedback provided, including its accuracy, relevance, or reliability. All feedback is subject to the terms set forth in the TetraConnect Hub Community Guidelines.
Updated 2 months ago