Job Monitoring
Monitor, analyze, and troubleshoot Lakehouse and TetraScience AI Services job executions by using the Jobs dashboard
The Jobs dashboard provides a centralized monitoring interface for all Lakehouse and AI Service job executions across the Tetra Data Platform (TDP). You can use this dashboard to monitor job runs, view performance metrics, access execution logs, and review detailed job metadata for Lakehouse, Tetraflow pipeline, and Scientific AI Workflow artifacts.
The Jobs dashboard can help you do the following:
- Monitor jobs across different artifact types.
- Identify and diagnose job failures with detailed logs and execution metrics.
- Troubleshoot job executions by accessing detailed job run information, logs, and metadata.
- Optimize scheduling and resource allocation by tracking job durations and execution patterns.
Prerequisites
Before you use the Jobs dashboard, make sure that you have either a preconfigured role or a custom role that has at least View access to Health Monitoring.
Access the Jobs Dashboard
To access the Jobs dashboard, do the following:
- Sign in to the TDP.
- In the left navigation menu, choose Operational Intelligence.
- Select Health Monitoring. Then, choose the Jobs tab.
Monitor Jobs
Supported Artifacts
The Jobs table displays information for the following artifact types.
| Artifact Type | Description |
|---|---|
| Lakehouse | Jobs that run Lakehouse data processing and transformation workloads |
| TetraFlow | Jobs associated with Tetraflow Pipelines that define SQL-based data transformations |
| Scientific AI Workflow | Jobs that run Scientific AI Workflow inference and analysis tasks |
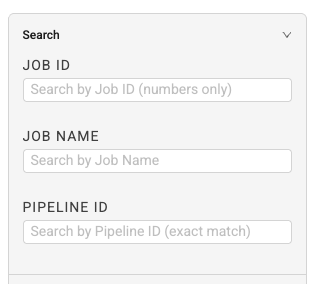
Search for a Specific Job
To search for a specific job, enter your search criteria into one of the following Search fields in the right pane:
- Job ID: Search by Job ID (numbers only)
- Job Name: Search by job name
- Pipeline ID: Search by pipeline ID (numbers only)
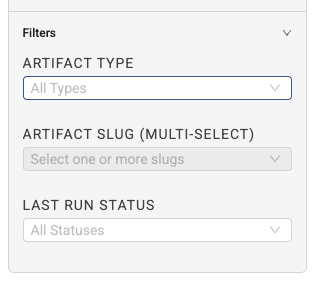
Filter the Jobs List
To narrow the list of jobs displayed, enter your filter criteria into one or more of the following Filters fields in the right pane:
- Artifact Type: Type of artifact associated with the job (Lakehouse, Tetraflow, or AI Workflow)
- Artifact Slug (Multi-Select): Unique identifier (slug) for the artifact
- Last Run Status: Last job run's status (Success, Failed, Running, Pending, or Cancelled)
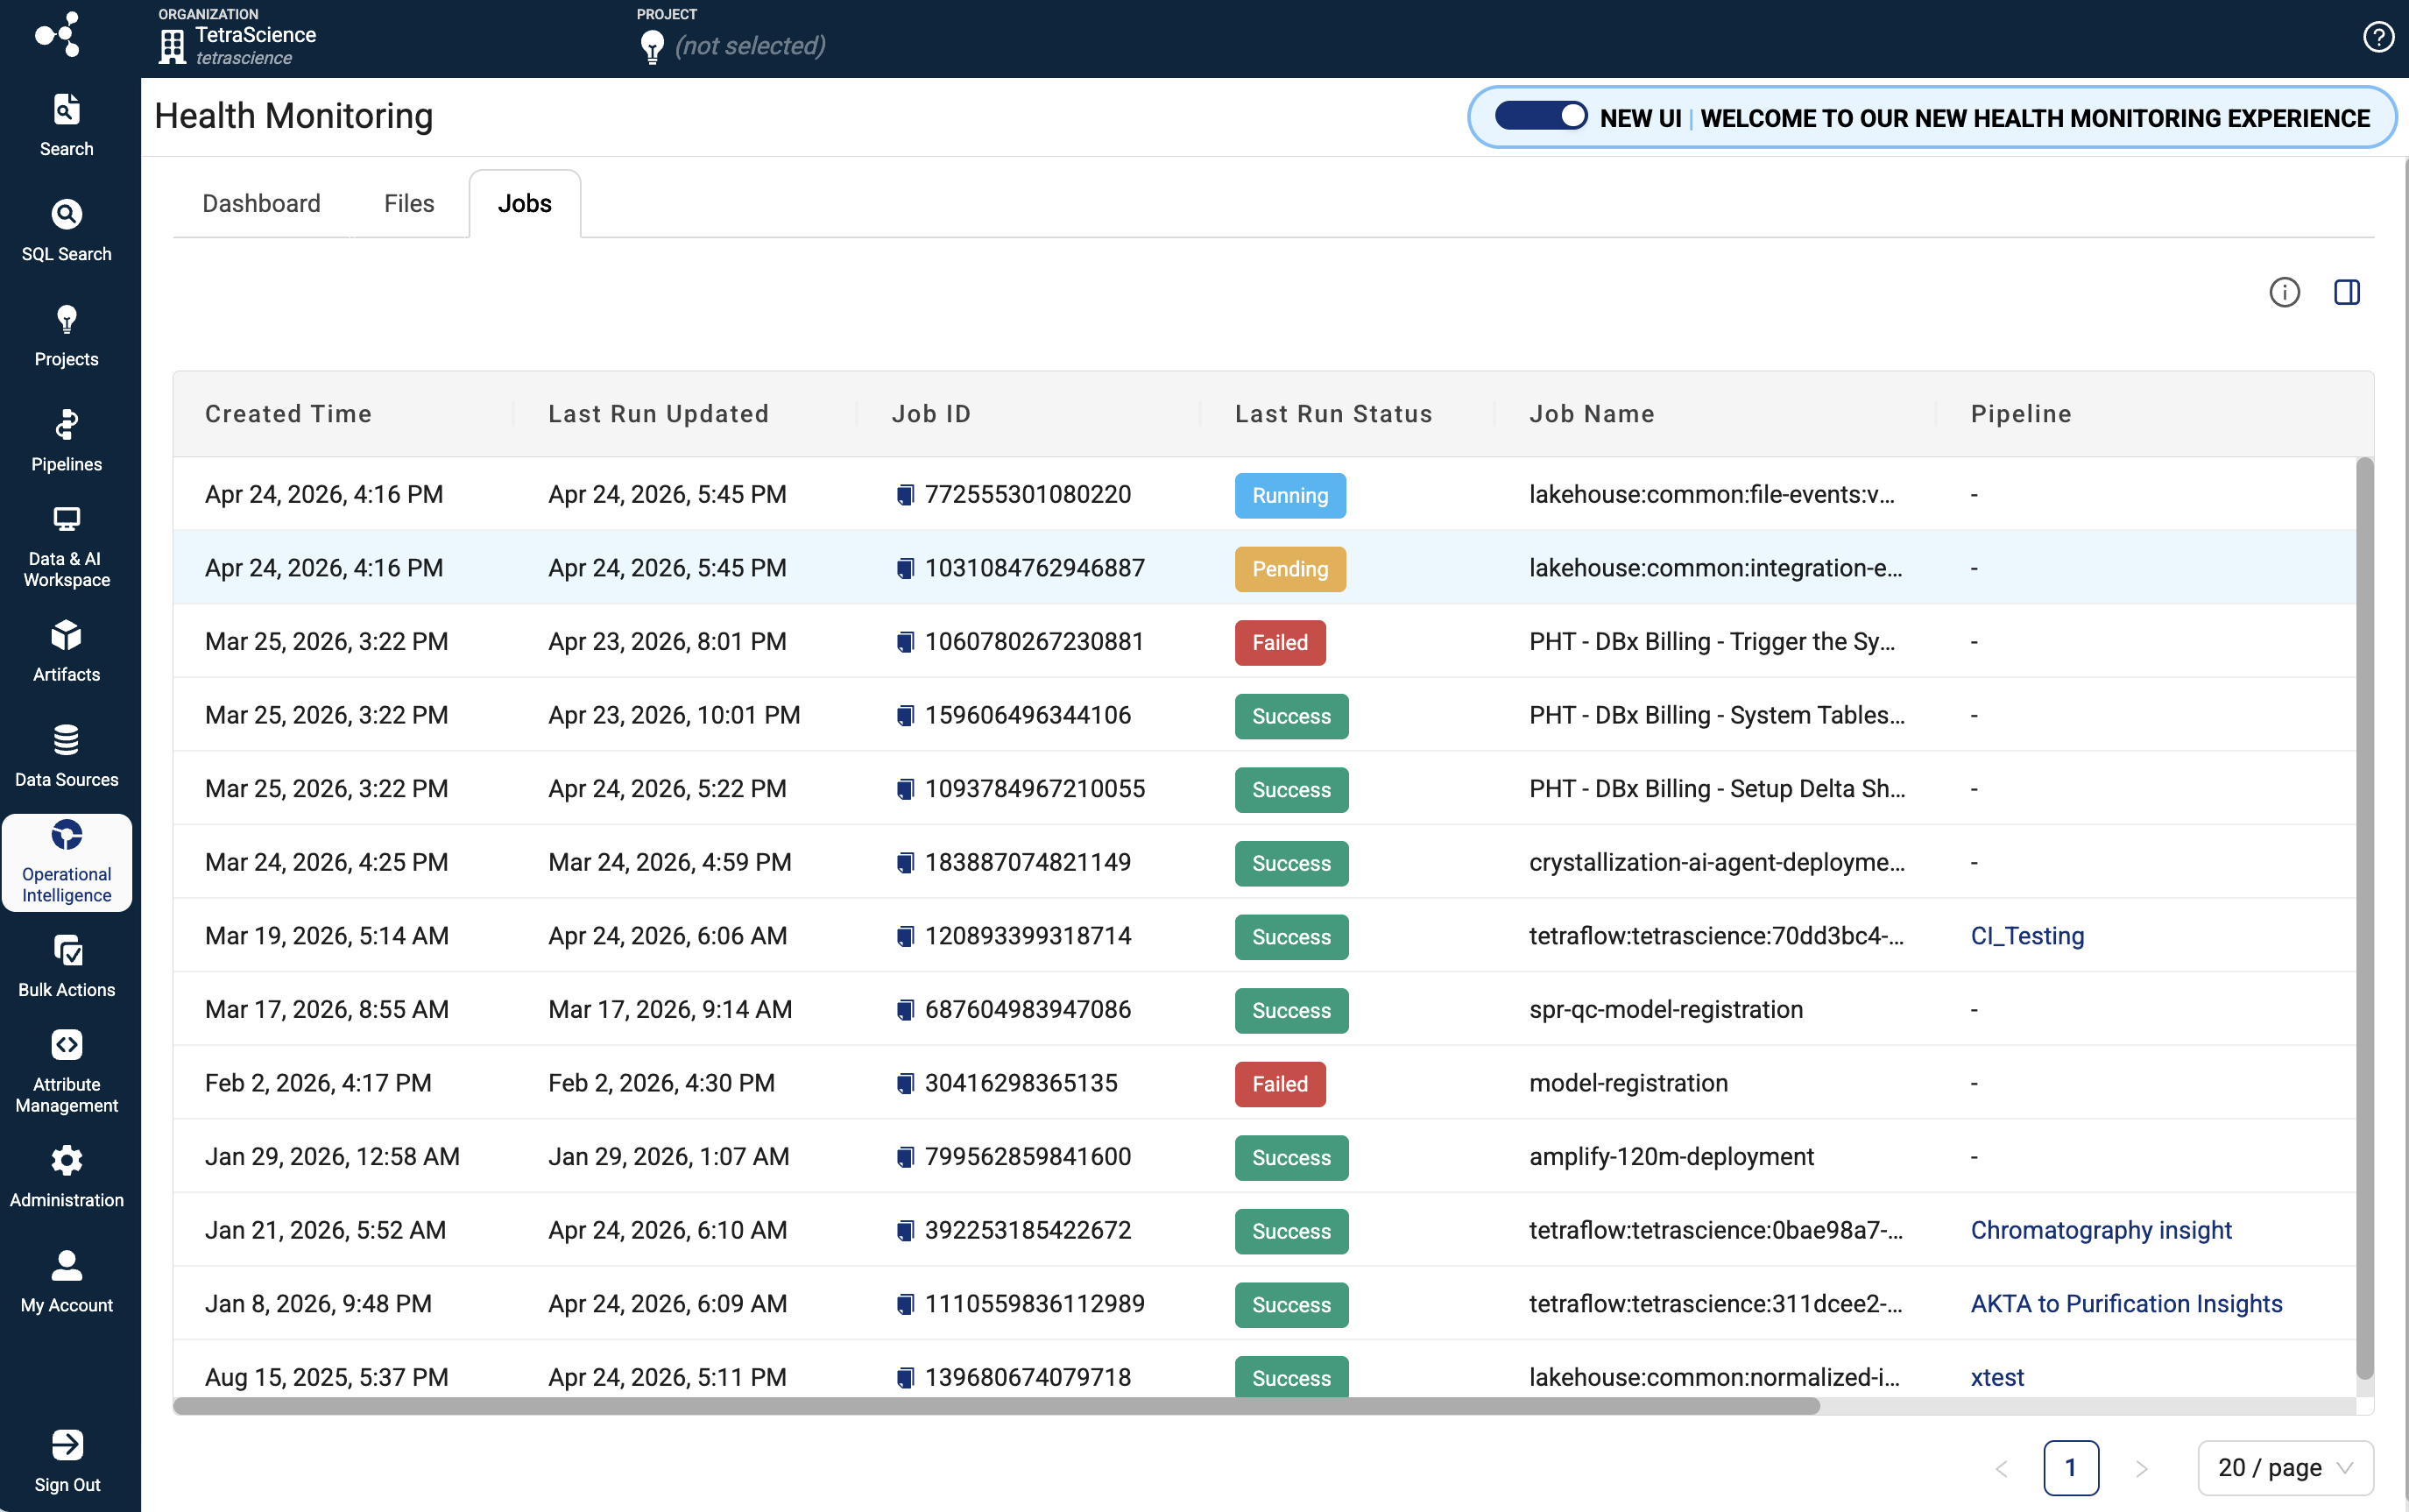
Jobs Table Information
Each row in the Jobs table includes the following details:
| Column | Description |
|---|---|
| Created Time | Job's created at timestamp |
| Last Run Updated | Date and time of the most recent job execution |
| Job ID | Unique identifier for the job |
| Last Run Status | Displays as a color-coded badge (green for success, red for failed, blue for running, yellow for pending, gray for cancelled/skipped) |
| Job Name | Name of the job |
| Pipeline | Pipeline name (displays only if there is a pipeline associated with the artifact) |
| Artifact Type | Type of artifact associated with the job (Lakehouse, Tetraflow, or AI Workflow) |
| Artifact Slug | Unique identifier (slug) for the artifact |
Identify and Diagnose Job Failures
To find failed jobs, review their execution logs, and determine root causes, do the following.
Find Failed Jobs
- On the Jobs dashboard, filter by Last Run Status and select Failed.
- Review the filtered list to identify jobs with recent failures.
- Select a failed job to open its Job details page.
Review Execution Logs
- On the Job's details page, review the list of job runs.
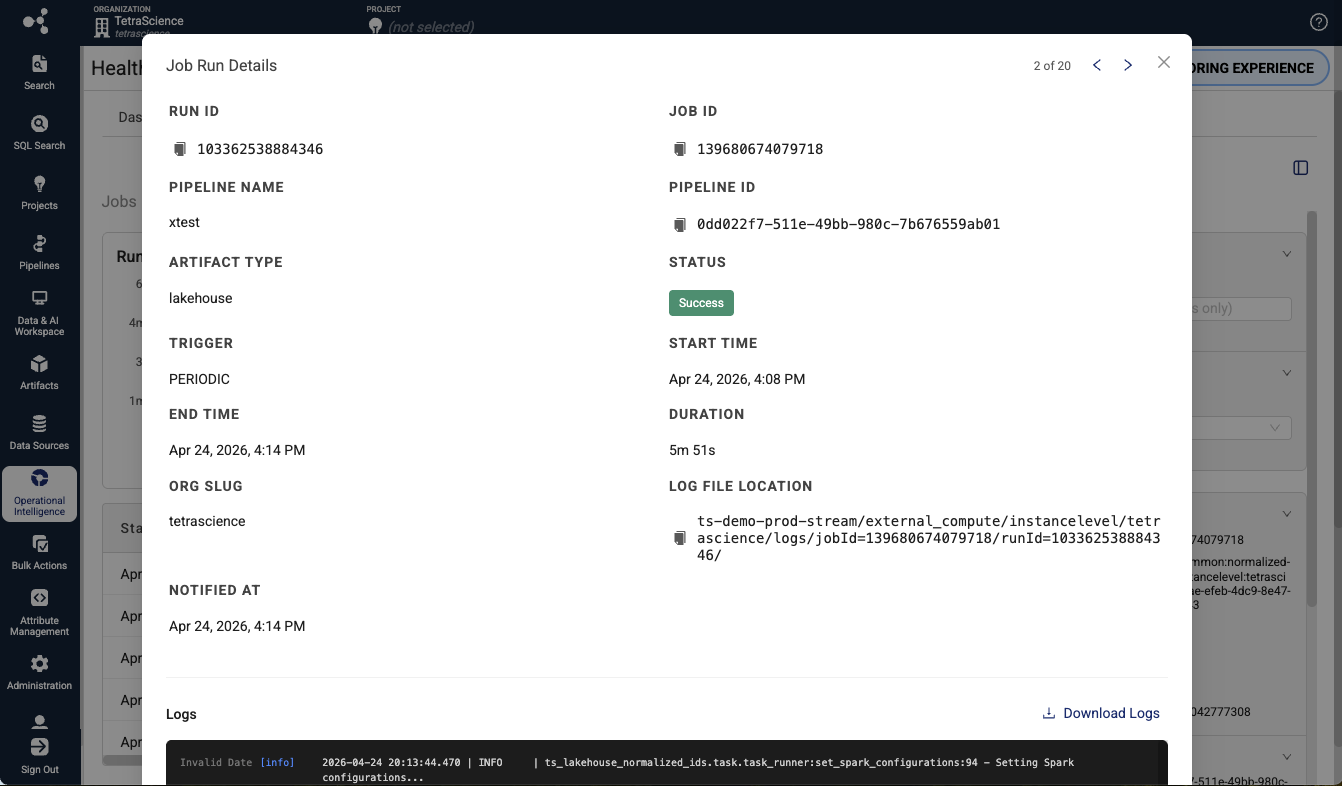
- Select the Run ID for the failed run you want to inspect. The Job Run Details dialog appears.
- Select the Logs section to view the execution logs for that run. The logs display timestamped entries that include standard output, error output, and system messages generated during job execution. Logs are retained for 90 days.
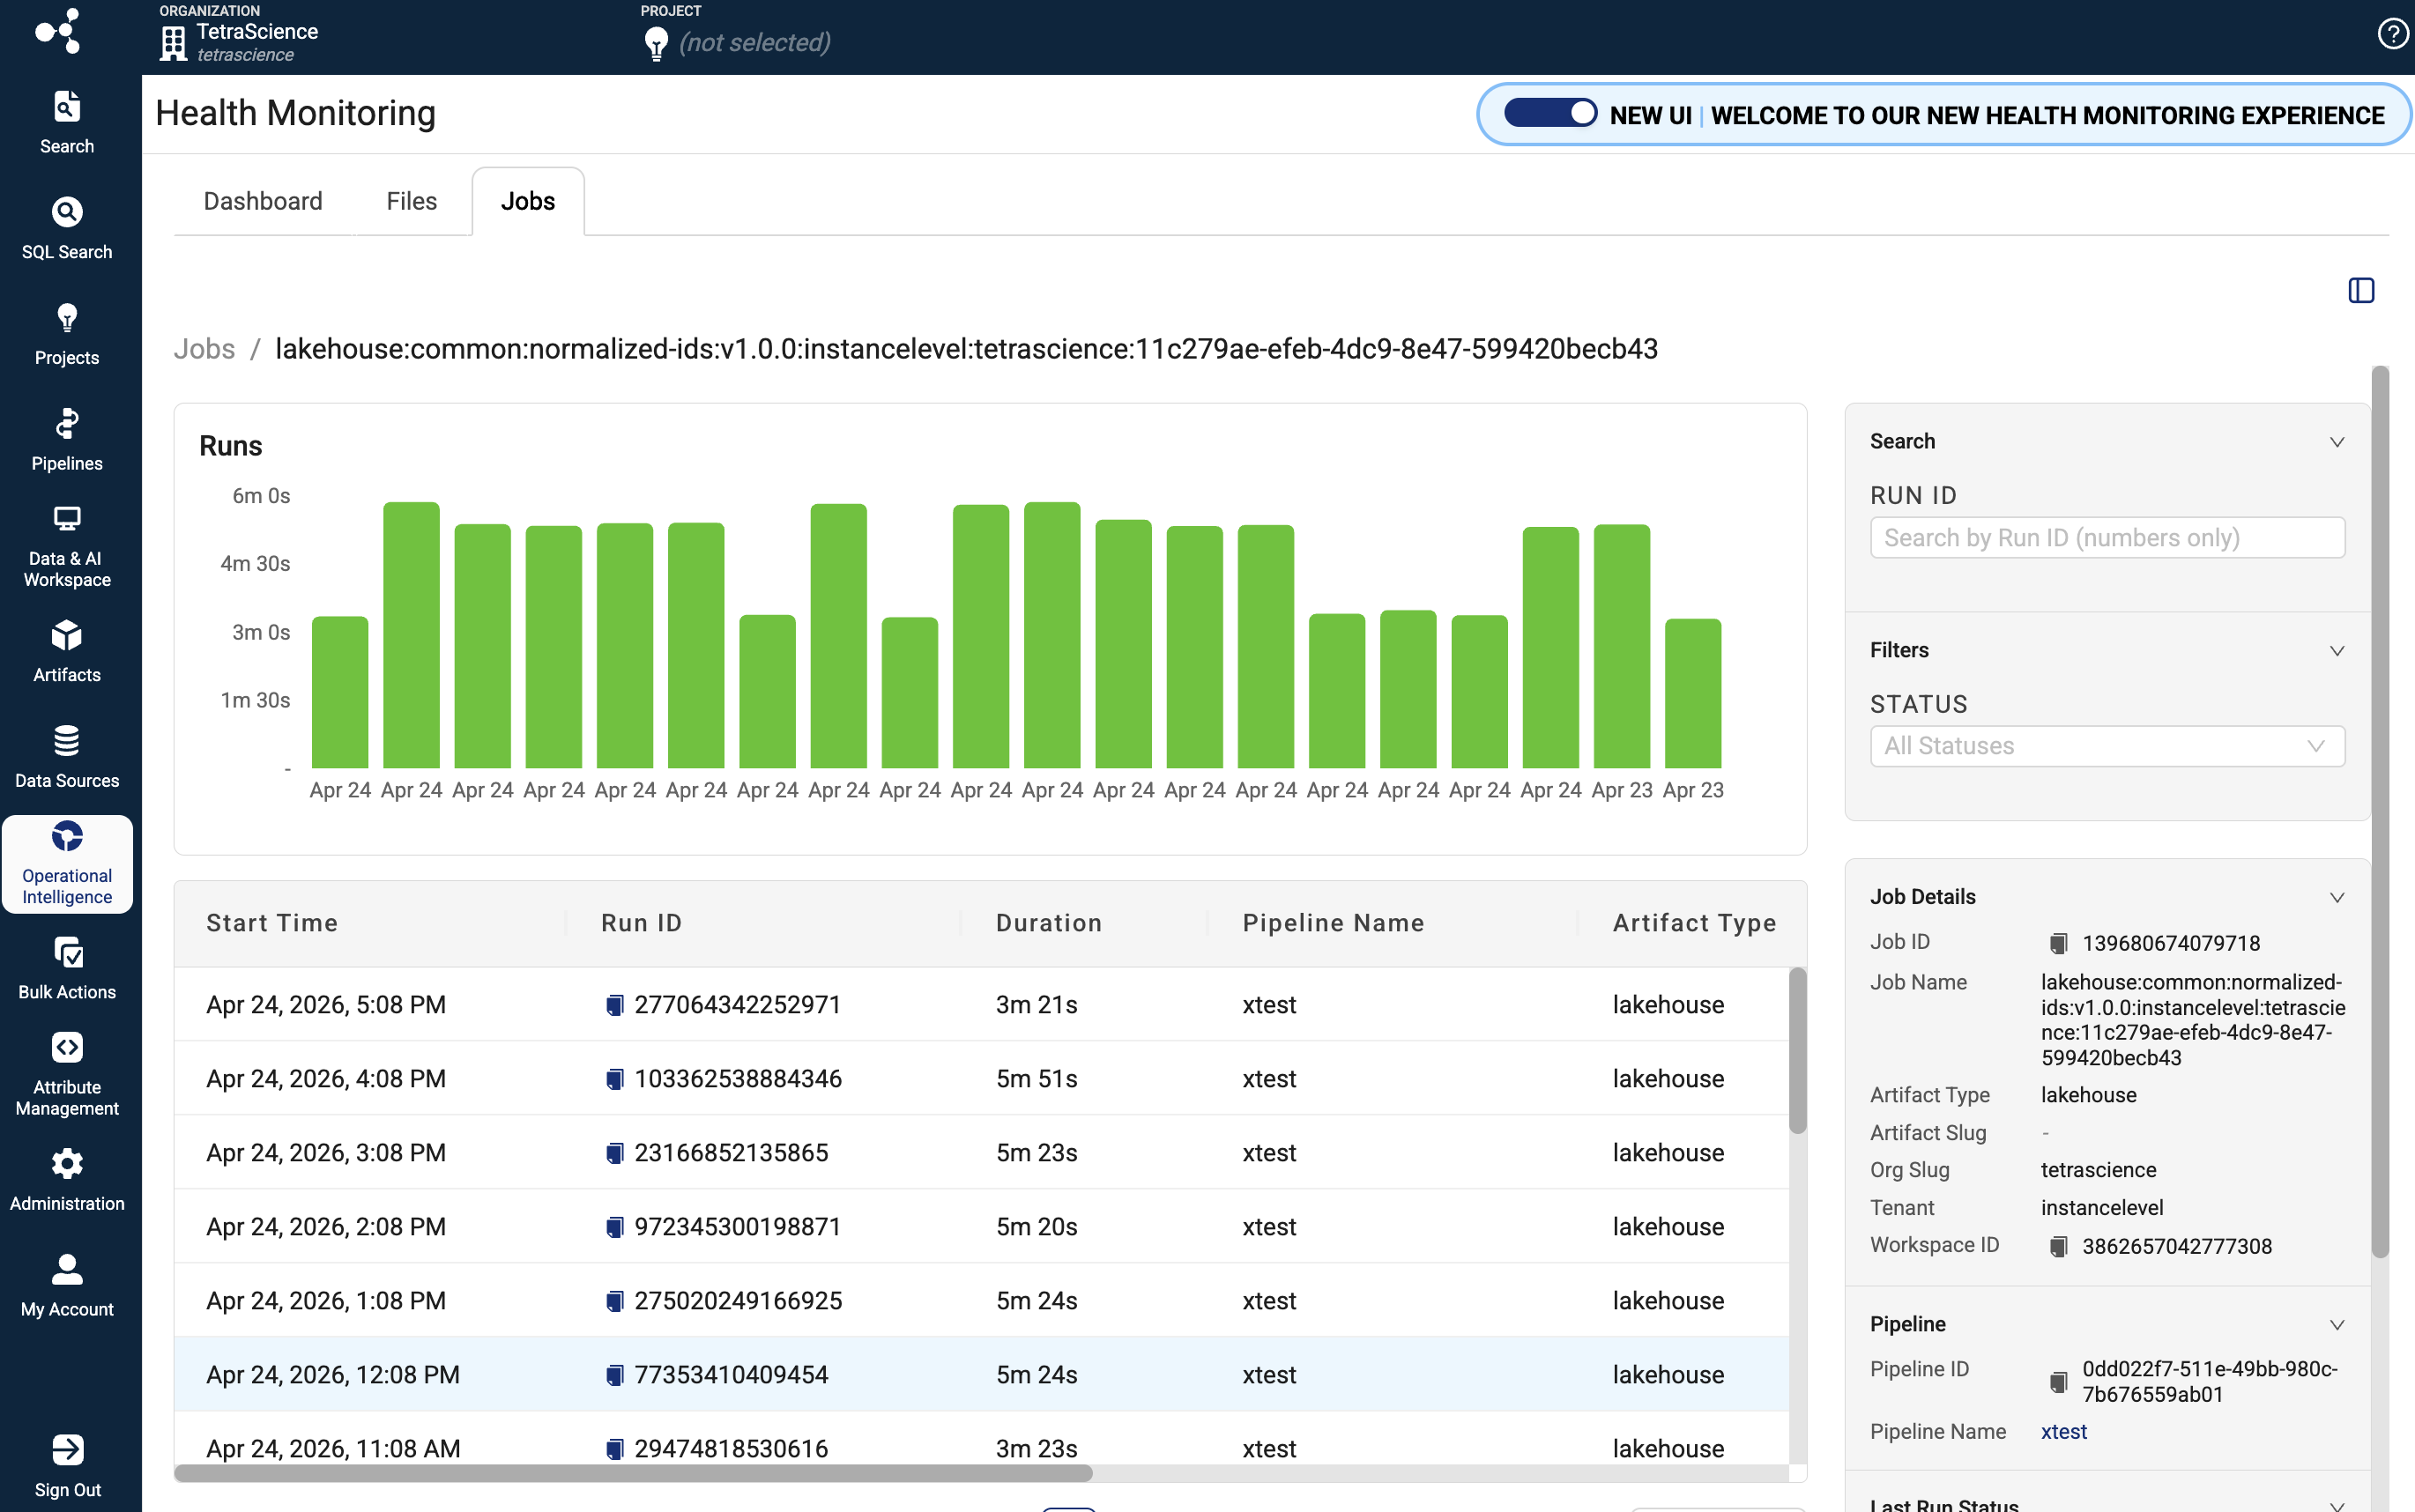
Review Execution Metrics
On the Job details page, the Job run history table provides the following metrics for each run:
| Column | Description |
|---|---|
| Start Time | The date and time the run started |
| Run ID | The unique identifier for the job run |
| Duration | The total execution time of the run |
| Status | The result status of the run (for example, Succeeded, Failed, Cancelled, or Running) |
| Pipeline Name | pipeline name, if there is one associated with the job |
| Artifact Type | Type of artifact associated with the job (Lakehouse, Tetraflow, or AI Workflow) |
| End Time | The date and time the run completed |
| Trigger | How the run was initiated (for example, scheduled or manual) |
Troubleshoot Job Executions
Use the Job details page to access detailed job run information, logs, and metadata for a specific job.
To open the Job details page, select a job name in the Jobs table.
Review Job Metadata
The Job Details page displays the following metadata:
- Job Name: The display name of the job.
- Job ID: The unique Databricks job identifier.
- Artifact Type: The artifact type (Lakehouse, TetraFlow, or AI Workflow).
- Created By: The user or system that created the job.
- Created At: The date and time the job was created.
- Cluster Configuration: The Databricks compute cluster configuration used by the job.
Optimize Job Scheduling and Resource Allocation
Use the Jobs dashboard to track job durations and execution patterns so that you can make informed decisions about scheduling and resource allocation.
- Review the Duration column in the Jobs table to identify long-running jobs that might benefit from cluster resizing or schedule adjustments.
- Compare Job Duration Trends on the performance charts to detect jobs whose execution times are increasing over time.
- Check the Trigger column in the Job Runs table to understand how jobs are initiated (scheduled versus manual).
- Monitor the Success Rate metric to evaluate whether resource constraints are contributing to job failures.
Troubleshoot Job Dashboard Issues
No Jobs Appear in the Dashboard
Verify that your TDP organization has either running ids-to-lakehouse, direct-to-lakehouse, or Tetraflow pipelines.
Job Logs Are Unavailable
Contact TetraScience to help troubleshoot and verify your log retention settings.
Stale Job Data
Refresh the page to retrieve the latest job data from Databricks. If the issue persists, contact TetraScience to help troubleshoot.
Documentation Feedback
Do you have questions about our documentation or suggestions for how we can improve it? Start a discussion in TetraConnect Hub. For access, see Access the TetraConnect Hub.
NOTEFeedback isn't part of the official TetraScience product documentation. TetraScience doesn't warrant or make any guarantees about the feedback provided, including its accuracy, relevance, or reliability. All feedback is subject to the terms set forth in the TetraConnect Hub Community Guidelines.
Updated 2 months ago