

Alert Management
The Alert Management page provides the ability to create and manage email alerts for Tetra Integrations in your Tetra Data Platform (TDP) environment. You can use these alerts to help you proactively monitor and maintain your data integrations.
The Alert Management page currently supports alerts for Tetra Agents, Tetra Connectors, and Tetra Hubs. Each integration type supports different alerts based on its specific monitoring needs.
Starting in Tetra v4.6.0, the Alert Management page also supports data ingestion alerts for Tetra File-Log Agents (FLA). You configure these alerts for an individual Agent, so you can tune each threshold to that Agent's expected upload volume, scan duration, and latency instead of applying one organization-wide threshold.
Access the Alert Management Page
To access the Alert Management page, do the following:
- Sign in to the TDP.
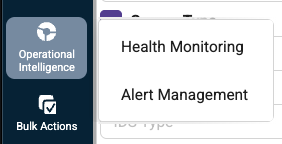
- In the left navigation menu, choose Operational Intelligence. Then, choose Alert Management.
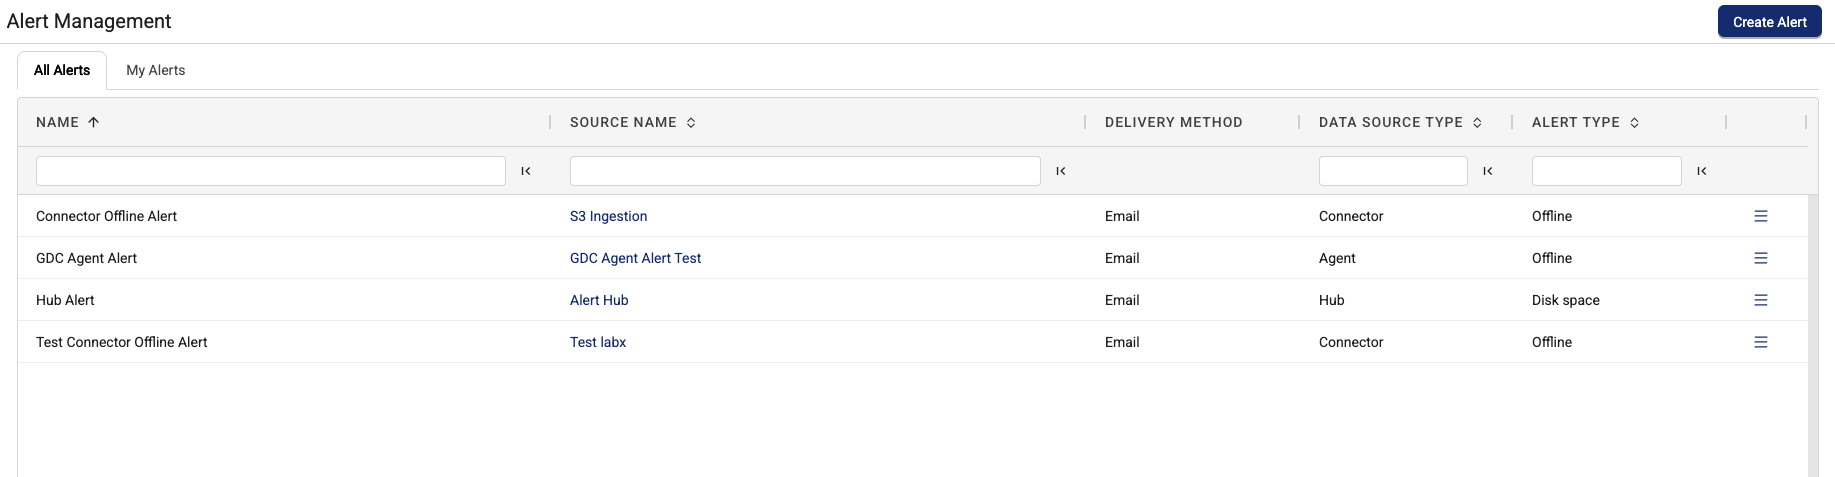
The Alert Management page appears, displaying a list of all configured alerts. The All Alerts tab displays all of the alerts configured in your organization. The My Alerts tab displays only the alerts that you're subscribed to.
Create an Alert
To create an email alert for a Tetra Integration, do the following:
- Open the Alert Management page.
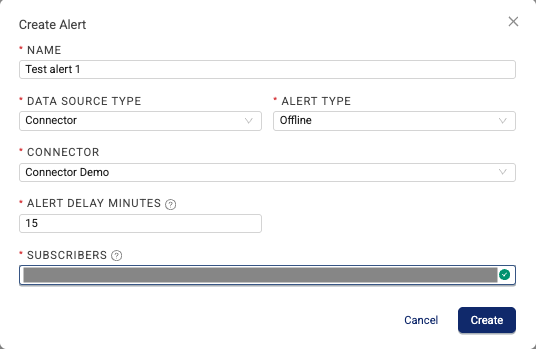
- Choose Create Alert. The Create Alert dialog appears.
-
Configure the alert by doing the following:
-
For NAME, enter a descriptive name for the alert.
-
For DATA SOURCE TYPE, select an integration type (Agent, Connector, or Hub).
-
For ALERT TYPE, select an alert type and configure any THRESHOLD if prompted. The available alert types depend on the data source type that you select. Data ingestion alerts are available only when you select Agent as the data source type and then select a Tetra File-Log Agent as the SOURCE. For details on available alerts, see Alert Types.
-
For SOURCE, select a specific integration from the list of available integrations in your organization.
-
For ALERT DELAY MINUTES, enter how long (in minutes) you want to delay the alert after it's initially triggered. Configuring this value to at least 5 minutes can help avoid false alarms from short-lived issues that resolve themselves.
The remaining fields depend on the alert type that you select:
- Data ingestion alerts show EVALUATION WINDOW (MINUTES) in place of ALERT DELAY MINUTES.
- File Ingest Rate Drop and Scan Duration Anomaly also provide an optional SENSITIVITY setting, which controls how far a metric must deviate from the Agent's baseline before the alert is sent.
- File Upload Latency provides a LATENCY THRESHOLD MINUTES setting.
- File Processing Failure is event-driven and doesn't provide a time window setting.
-
For SUBSCRIBERS, enter a comma-separated list of the email addresses that you want to send the alerts to.
-
-
Choose Create.
NOTEYou can't edit an alert after it's created. To update an existing alert, you must first delete it and then create a new one.
Alert Types
Connector Alerts
| Alert Type | Description |
|---|---|
| Offline | Notifications for Offline Connectors that aren't intentionally deactivated through the TDP user interface. When a Connector is in RUNNING or IDLE status, it will send heartbeats to the TDP to signify that it is able to communicate with the platform. A Connector is considered offline if it's not disabled and the TDP stops receiving heartbeats from it. |
Agent Alerts
| Alert Type | Description |
|---|---|
| Offline | Notifications for Offline Agents that aren't intentionally deactivated through the TDP user interface. When an Agent is in ENABLED status, it will send heartbeats to the TDP to signify that it is able to communicate with the platform. An Agent is considered offline if it's not disabled and the TDP stops receiving heartbeats from it. |
| File Processing Failure | Notifications for when a file uploaded by an Agent fails to process. This alert is event-driven, so it's sent when a failure occurs and doesn't use a time window. It's available for Tetra File-Log Agents, Tetra Empower Agents, and Tetra Chromeleon Agents at supported versions. |
Data Ingestion Alerts
NOTEIn Tetra v4.6.0, these alert types are available for Tetra File-Log Agents (FLA) only. Support for other Tetra Integrations is planned for a future release.
Data ingestion alerts help you detect when data flow degrades for a specific Agent, including when an Agent is still online and sending heartbeats but isn't delivering data as expected. You configure each of these alerts for an individual Agent, and you can filter the alert list on the Alert Management page by Agent to review every data ingestion alert that's configured for a specific FLA.
| Alert Type | Description |
|---|---|
| File Upload Silence | Notifications for when an Agent's file uploads fall below an expected volume within a configured timeframe, including when uploads drop to zero. Use this alert to detect an Agent that's running and sending heartbeats, but that has stopped scanning or uploading files. |
| File Ingest Rate Drop | Notifications for when an Agent's file or record ingest rate falls significantly below its established baseline. This alert detects an acute drop in throughput, rather than a gradual decline. |
| File Upload Latency | Notifications for when the end-to-end latency from an Agent's file upload to that data becoming queryable in the TDP exceeds a configured threshold. |
| Scan Duration Anomaly | Notifications for when a specific Agent's scan of a monitored project takes abnormally long compared to that Agent's historical baseline. Because an Agent continues to send heartbeats during a long-running scan, this condition doesn't trigger an Offline alert. |
Tetra Hub Alerts
These alerts apply to on-premises Tetra Hubs. Cloud Hubs support the Offline alert only. The Disk Space alert and memory alerts don't apply to Cloud Hubs, because a Cloud Hub is a managed cloud deployment and doesn't run on a customer-managed host machine.
| Alert Type | Description |
|---|---|
| Offline | Notifications for Offline Tetra Hubs that aren't intentionally deactivated through the TDP user interface. When a Tetra Hub is in ENABLED status, it will send heartbeats to the TDP to signify that it is able to communicate with the platform. A Tetra Hub is considered offline if it's not disabled and the TDP stops receiving heartbeats from it. |
| Disk Space | Notifications for when disk usage exceeds a configured threshold. The threshold is configured as a percentage of the host machine's available disk space. |
| L7 Proxy Uptime | Notifications for when the uptime for a Tetra Hub's squid forward proxy (L7 Proxy) component falls below a configured threshold. The threshold is configured as the average uptime of the component in minutes. |
| L7 Nginx Uptime | Notifications for when the uptime for a Tetra Hub's reverse Nginx proxy (L7 Proxy) component falls below a configured threshold. The threshold is configured as the average uptime of the component in minutes. |
| L7 Socat Uptime | Notifications for when the uptime for a Tetra Hub's L7 Proxy Socat component falls below a configured threshold. The threshold is configured as the average uptime of the component in minutes. |
Alert Emails
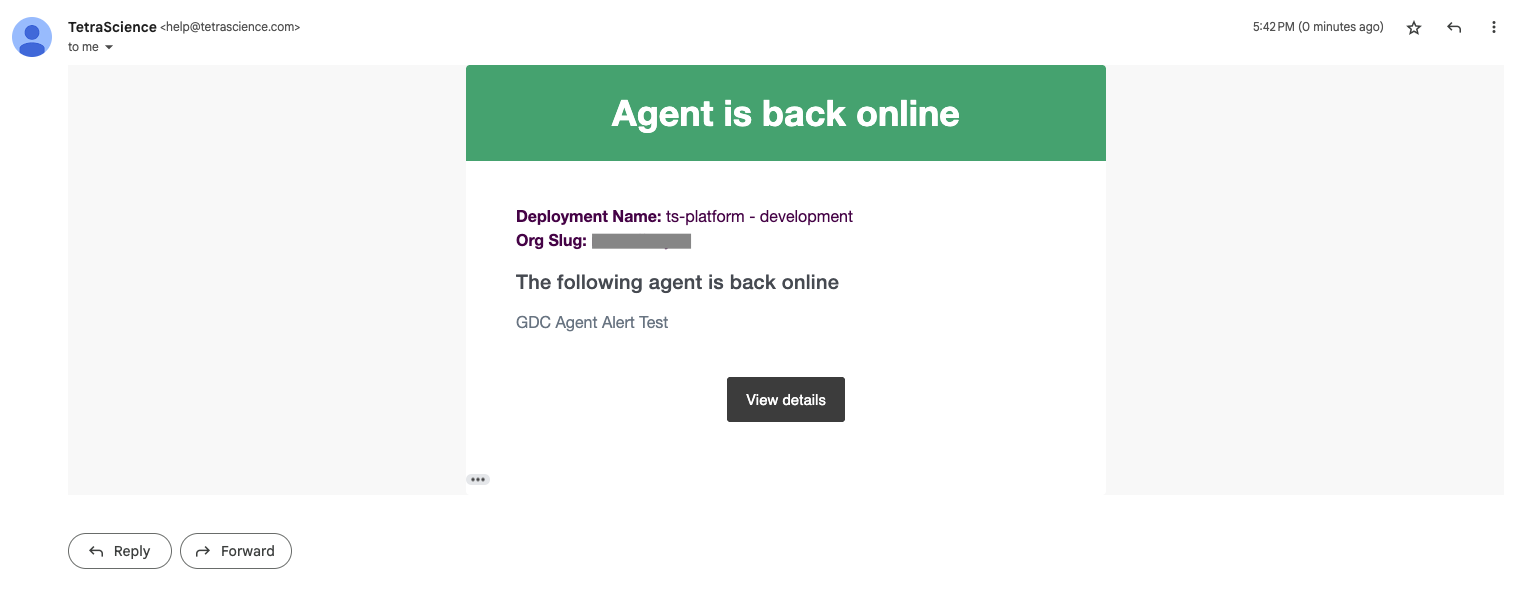
When an alert is triggered, it sends an email to each configured subscriber. The email contains details for the affected TDP deployment, organization, and integration as well as when the alert was triggered. A View details button provides a link to the affected integration's Details page in the TDP user interface.
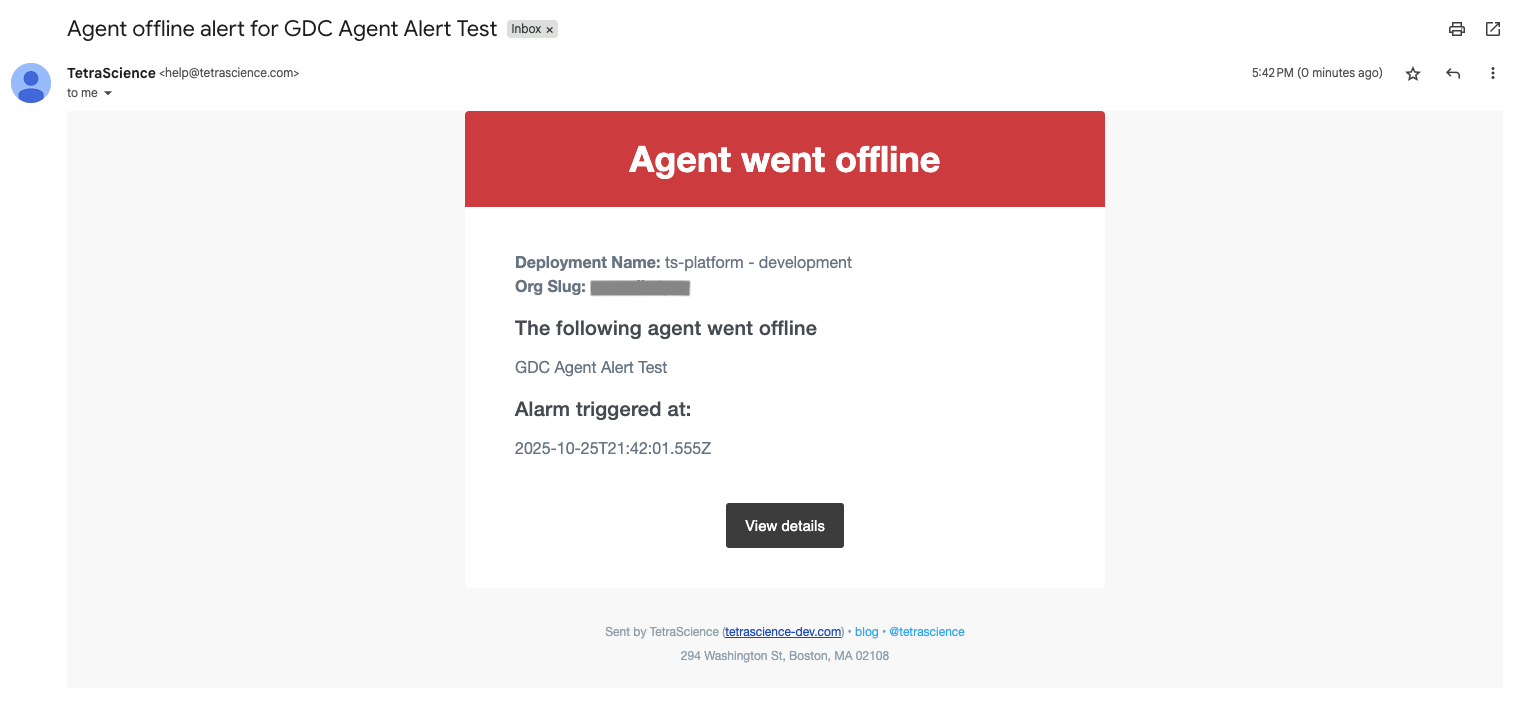
When the problem that triggered an alert is resolved, the TDP sends a follow-up email to all of the alert's subscribers indicating that the alert is resolved.
NOTEOffline Alert emails aren't sent when an integration is deactivated intentionally through the TDP user interface.
Manage Alerts
After you create an alert, you can use the Alert Management page to either view its configuration details or delete it. You can't edit alerts after you create them.
View Alert Details
To view information about a specific alert, do the following:
- Open the Alert Management page.
- Find the alert either in the All Alerts or My Alerts tabs, and then select the menu icon on the far right side of that alert's row. The All Alerts tab displays all of the alerts configured in your organization. The My Alerts tab displays only the alerts that you're subscribed to.
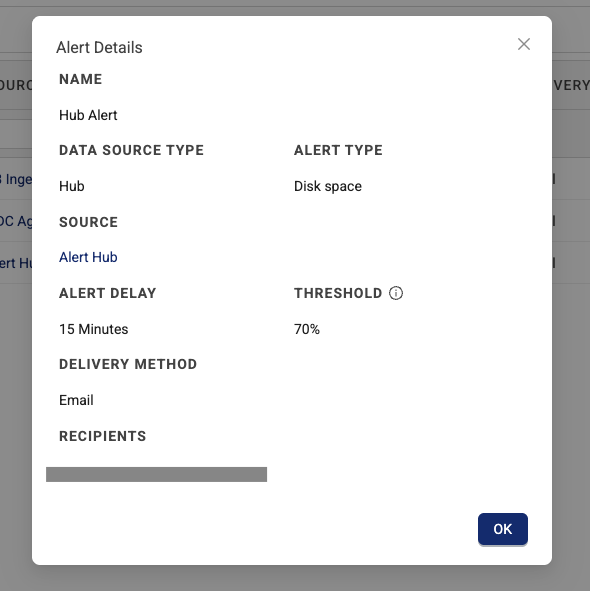
- Select View Details. The Alert Details dialog displays the alert's configuration details.
Delete an Alert
To delete an alert, do the following:
- Open the Alert Management page.
- Find the alert either in the All Alerts or My Alerts tabs, and then select the menu icon on the far right side of that alert's row. The All Alerts tab displays all of the alerts configured in your organization. The My Alerts tab displays only the alerts that you're subscribed to.
- Select Delete. A Delete Alert dialog appears and prompts you to confirm that you want to permanently delete the alert.
- Choose Delete to confirm that you want to delete the alert. This action can't be undone.
Documentation Feedback
Do you have questions about our documentation or suggestions for how we can improve it? Start a discussion in TetraConnect Hub. For access, see Access the TetraConnect Hub.
NOTEFeedback isn't part of the official TetraScience product documentation. TetraScience doesn't warrant or make any guarantees about the feedback provided, including its accuracy, relevance, or reliability. All feedback is subject to the terms set forth in the TetraConnect Hub Community Guidelines.
Updated about 1 month ago