Health Monitoring App
The Health Monitoring App provides two comprehensive dashboards in the Tetra Data Platform (TDP) user interface to help customers gain an end-to-end understanding of data usage and downtime as well as platform usage:
- Health Monitoring provides metrics for ingestion failures and latency for on-premises Tetra File-Log Agents, Tetra Chromeleon Agents, Tetra Empower Agents, and Tetra Data Pipelines.
- Operational Insights provides metrics for data volume and flow as well as user activity and engagement.
NOTETo help you proactively monitor your data sources, you can also activate the optional Alert Management page and configure email notifications for offline integrations.
Health Monitoring App Dashboard 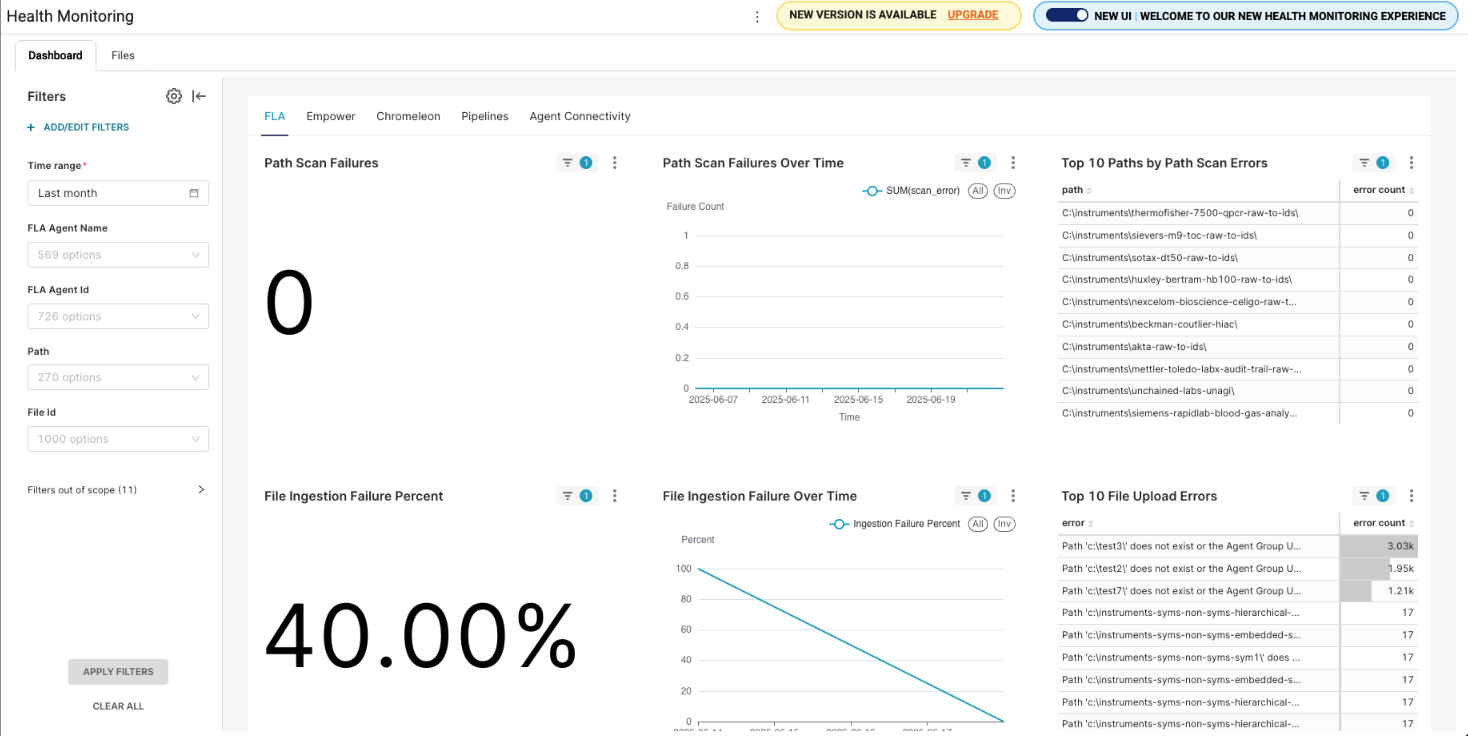 Operational Insights Dashboard
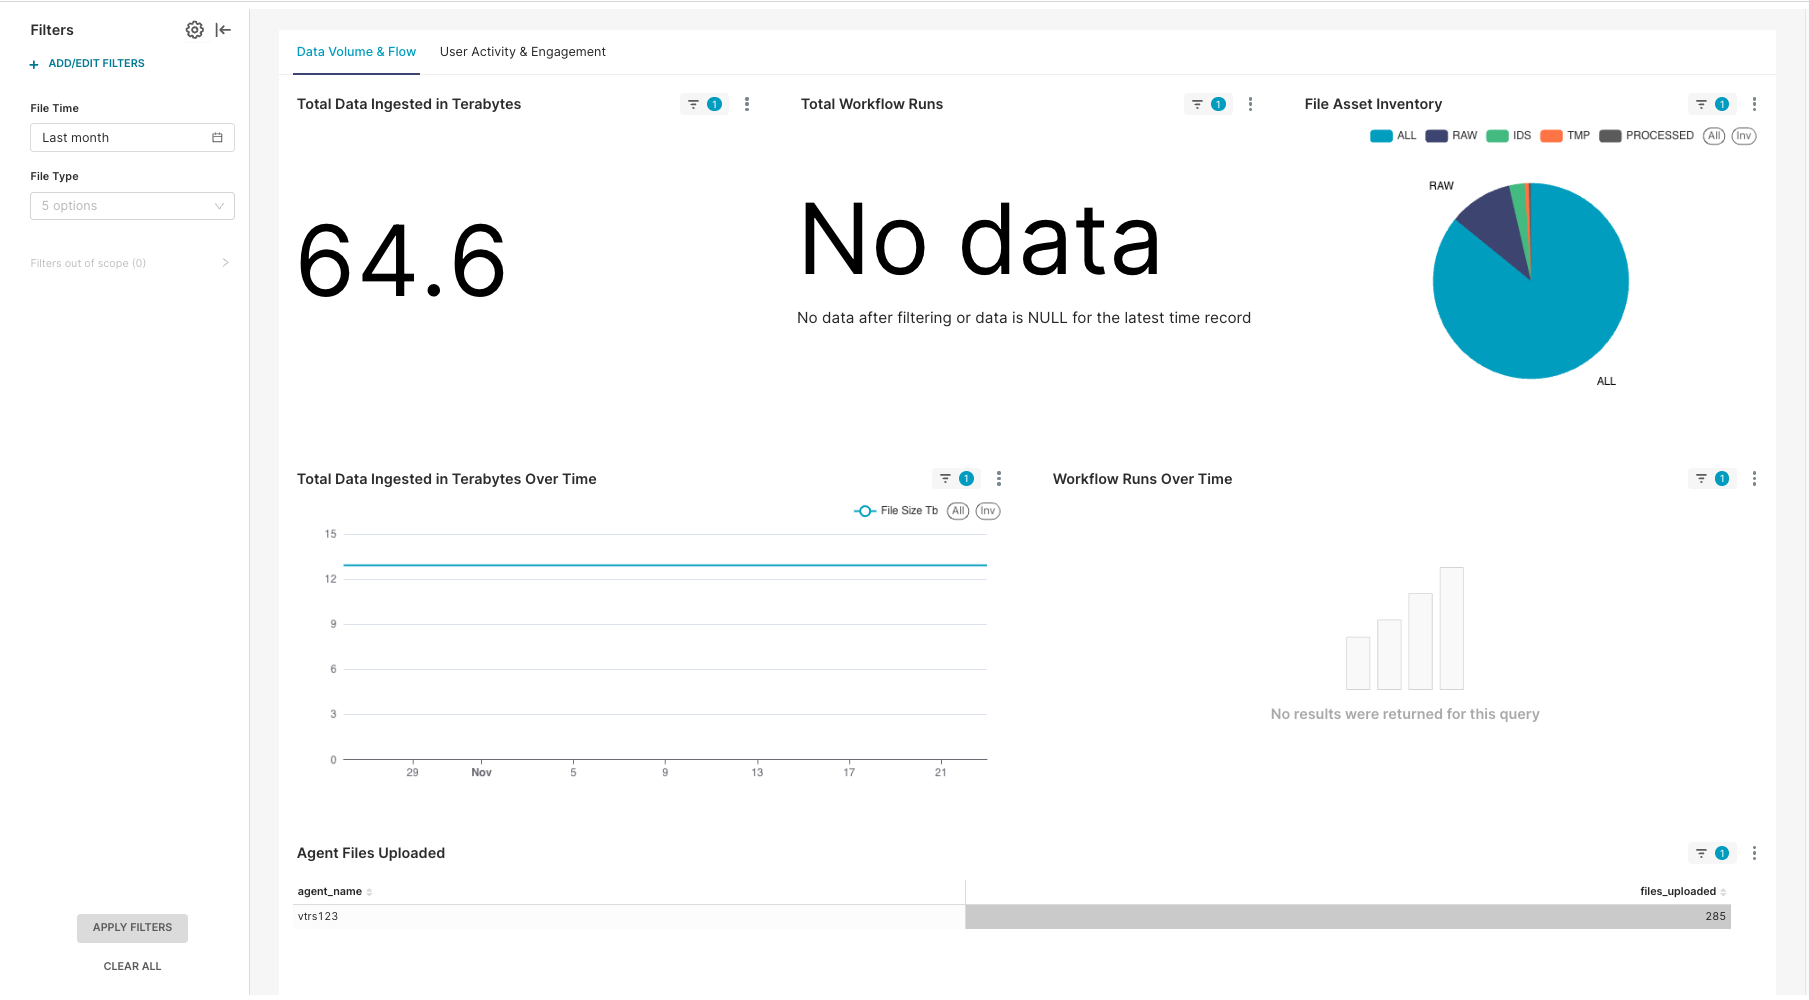
User Guides
For more information about how to use the Health Monitoring App, see the latest user guides:
Health Monitoring App User Guides
Operational Insights User Guides
Prerequisites
- TDP v4.5.0 or later for Health Monitoring App v2.0.0 and later (Health Monitoring App v1.x is supported by TDP v4.3.0-v4.5.0 only)
IMPORTANTUpgrading to Health Monitoring App v2.0.0 or later is recommended after upgrading to TDP v4.5.0 or later for improved functionality and will be required starting in TDP v4.6.0. For more information, see the Health Monitoring App v1.1.0 and Earlier Deprecation Notice.
For Customer-Hosted TDP Environments Only
- The TetraScience Databricks integration (which supports the Lakehouse). Contact your customer account leader to set this up.
- The TDP's Transport Layer Security (TLS) certificate must validate the following endpoint:
*.data-apps.tdp-hostname.com - The Domain Name Server (DNS) zone for
tdp-hostname.commust have a CNAME record routing*.data-apps.tdp-hostname.comtotdp-hostname.com
Activate the Health Monitoring App
To activate the Health Monitoring App in your TDP environment, contact your customer account leader.
NOTEIn TDP v4.5.0 and later, the Operational Insights menu option now displays for all customers by default, whether or not the Health Monitoring App is installed and activated in their TDP environment. Previously, the Operational Insights dashboard required the Health Monitoring App to be manually activated by a customer account leader.
For the Operational Insights dashboard to appear and populate with usage data, either a user with Administrator permissions must choose to enable the dashboard in the UI after selecting the Operational Insights menu option, or customers must have the Health Monitoring App activated in their TDP environment. If the app isn't activated or the Operational Insights dashboard isn't enabled through the UI by and admin, then customers will see a prompt to either enable the dashboard if they're an admin, or to contact their admin to enable it if they're a non-admin user.
Enabling the Operational Insights dashboard through the UI installs the Health Monitoring App and activates the Operational Insights dashboard only. It doesn't activate the Health Monitoring App dashboard, which must still be done in coordination with TetraScience.
Upgrade the Health Monitoring App
To upgrade the Health Monitoring App to the latest version after it's activated, do the following:
- Open the Health Monitoring App.
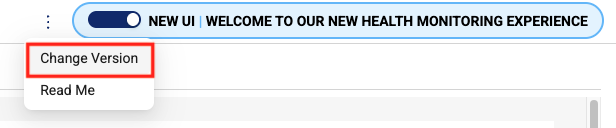
- Click the three-dot menu icon next to the NEW UI | WELCOME TO OUR NEW HEALTH MONITORING EXPERIENCE display at the top of the page.
- Select Change Version. The Change Version dialog appears.
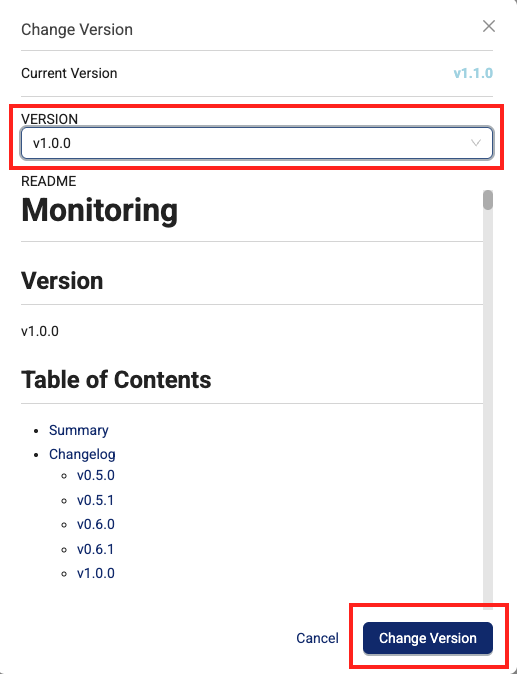
- In the VERSION dropdown, select the version that you want to upgrade to.
- Choose Change Version.
Activation Considerations
When activating the Health Monitoring App, keep in mind the following:
- After being activated, the app may return a
500internal server error as it establishes a new user database. To resolve the issue, log out of the TDP, close your web browser, and then reopen the browser and sign back in to the TDP. - The app might also display a Workgroup Not Found error when you open it the first time. To resolve the issue, you must rotate your organization-level SQL Credentials. Keep in mind, the new set of generated credentials will cause the previous set of credentials to stop working.
- The app can be deactivated at any time, if needed.
- (For customer-hosted deployments only) Activating the Health Monitoring App introduces additional data processing costs in the Data Lakehouse. To process integration events in near real time, the app creates its own silver Lakehouse Tables that are required for data cleaning and validation. These tables support the analytics displayed in the Health Monitoring App and are activated through a feature flag (
enable_dam_silver_tables), which can be turned off at any time. For a cost estimate based on your specific needs, contact your customer account leader.
Documentation Feedback
Do you have questions about our documentation or suggestions for how we can improve it? Start a discussion in TetraConnect Hub. For access, see Access the TetraConnect Hub.
NOTEFeedback isn't part of the official TetraScience product documentation. TetraScience doesn't warrant or make any guarantees about the feedback provided, including its accuracy, relevance, or reliability. All feedback is subject to the terms set forth in the TetraConnect Hub Community Guidelines.
Updated 2 months ago