Monitor Data Hub Connectors Health
The Datahub(s) Connectors Health Dashboard provides statistical information on the health of your Data Hubs and their associated Connectors.
Access the Datahub(s) Connectors Health Dashboard
To view the Datahub(s) Connectors Health Dashboard, do the following:
- Sign in to the TDP as a user with an Administrator role.
- In the left navigation menu, choose Operational Intelligence (menu option displays as Health Monitoring in TDP v4.4.0 and earlier). Then, select Health Monitoring.
- Choose the Data Hub(s) Connectors tab. The Data Hub(s) Connectors Health Dashboard appears.
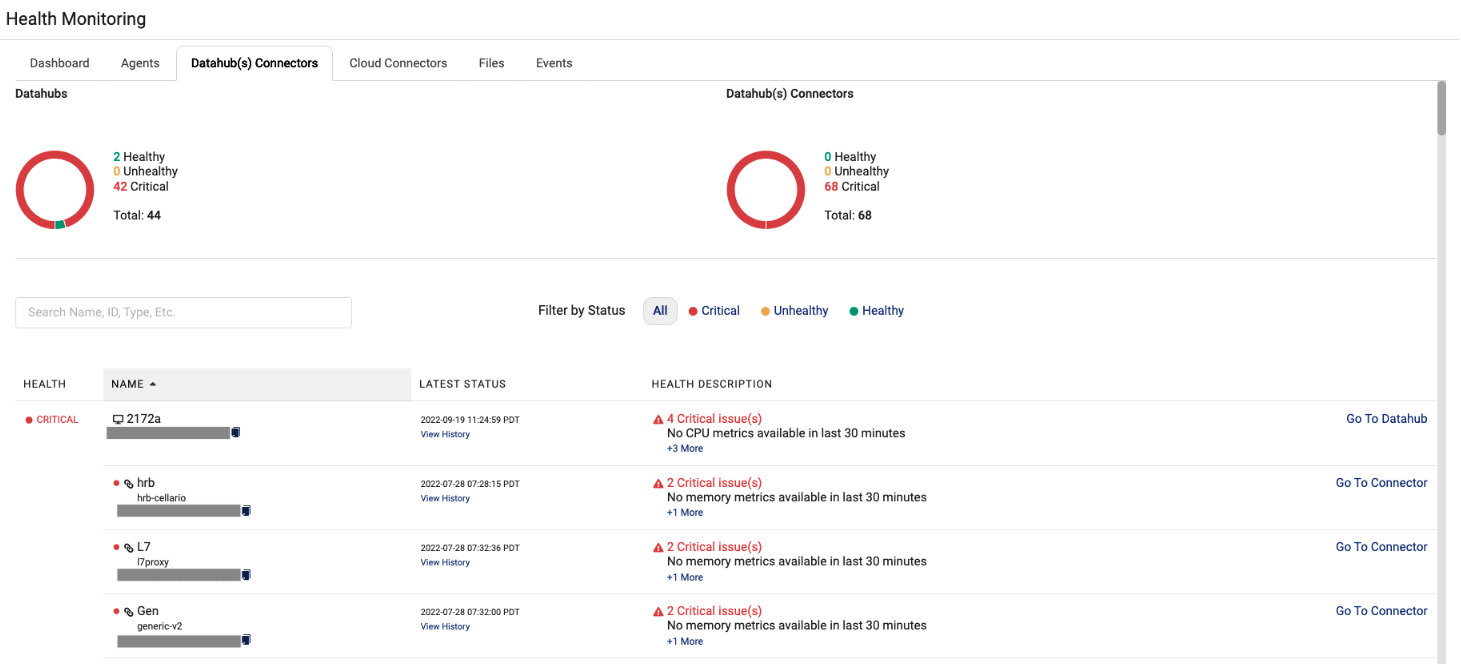
The aggregate status of Healthy, Unhealthy, and Critical Data Hubs and their associated connectors display as graphics at the top of the page. A Data Hub and their associated connectors may exist in these possible states:
| State | Data Hub or Data Hub Connector | Event |
|---|---|---|
| Healthy | A Data Hub is in a Healthy state when: | - Online: The last status received was 3 or less minutes ago. - Environment: Percentage of disk space used, the percentage of memory used, and/or CPU usage is less than or equal to 80%. |
| Data Hub Connector is in a Healthy state when: | - Online: The last status received was 3 or less minutes ago. - Environment: Percentage of memory used is less than or equal to 80%. | |
| Unhealthy | A Data Hub is in an Unhealthy state when: | - Online: A status has not been received in greater than 3 but less than 5 minutes. - Environment: Percentage of disk space used, the percentage of memory used, and/or CPU usage is greater than 80% but less than or equal to 90%. |
| A Data Hub Connector is in an Unhealthy state when: | - Online: A status has not been received in more than 3 minutes but less than or equal to 5 minutes. - Environment: Memory usage is greater than 80% but less than or equal to 90% for the past 5 contiguous minutes. | |
| Critical | A Data Hub is in a Critical state when: | - Online: The status has not been received for more than 5 minutes. - Environment: Percentage of disk space used, the percentage of memory used, and/or CPU usage is greater than 90%. |
| A Data Hub Connector is in a Critical state when: | - Online: A status has not been received in the past 5 minutes. - Environment: Percentage of memory used is greater than 90% for the past 5 contiguous minutes. |
- To search for a component name, you can enter all (or a portion) of the Data Hub's name or unique identifier (UID) in the Search box.
- To apply a filter by status, you can also select All, Critical, Unhealthy, or Healthy next to the Search box.
This table describes the health details for the individual Data Hub or Data Hub Connector:
| Field | Description |
|---|---|
Health |
Displays the status for the Data Hub(s) and their connectors. By default, all status types display on this dashboard. |
Name |
Name of the Data Hub and connector(s) (and their representative icons) You can hover over the Data Hub name to review these details:
To copy the unique ID for the component instance, you can click the copy file icon. |
Latest Status |
When the latest status (Date/Time format) was assigned. To review a component's status history, click the View History link below the status. |
Health Description |
Explains why the component has been assigned the critical state. By default, only one issue is shown. If there is more than one issue, then a link displays (for example, +1 More) indicating there are additional issues to review. |
Go To Data Hub |
Provides a link you can click to review the configuration details for the particular Data Hub or connector. |
Documentation Feedback
Do you have questions about our documentation or suggestions for how we can improve it? Start a discussion in TetraConnect Hub. For access, see Access the TetraConnect Hub.
NOTEFeedback isn't part of the official TetraScience product documentation. TetraScience doesn't warrant or make any guarantees about the feedback provided, including its accuracy, relevance, or reliability. All feedback is subject to the terms set forth in the TetraConnect Hub Community Guidelines.
Updated 2 months ago