Monitor Files Health
Data consistency is crucial for data stored and accessed within the Tetra Data Platform (TDP). The Files health monitoring dashboard on the Health Monitoring page helps you monitor and report on the health of your data files in the TDP. It also provides options to either reprocess selected files, or create Reconciliation Jobs to fix any issues.
Data is currently stored in the following locations:
- Tetra Data Lake (Amazon S3)
- File Registration Database
- System Properties (FileInfo) Service
- Search Indices (OpenSearch)
- SQL (Amazon Athena)
As an administrator, you can use the Files health monitoring dashboard to quickly identify any inconsistencies that exist across these services.
NOTETo view file events generated by the Tetra File-Log Agent outside of the TDP, select the Events tab on the Health Monitoring Dashboard. For more information, see Monitor Events.
Access the Files Health Dashboard
To view the Files Health Monitoring Dashboard, do the following:
- Sign in to the TDP as a user with an Administrator role.
- In the left navigation menu, choose Operational Intelligence (menu option displays as Health Monitoring in TDP v4.4.0 and earlier). Then, select Health Monitoring.
- Select the Files tab. The Files Health dashboard appears.
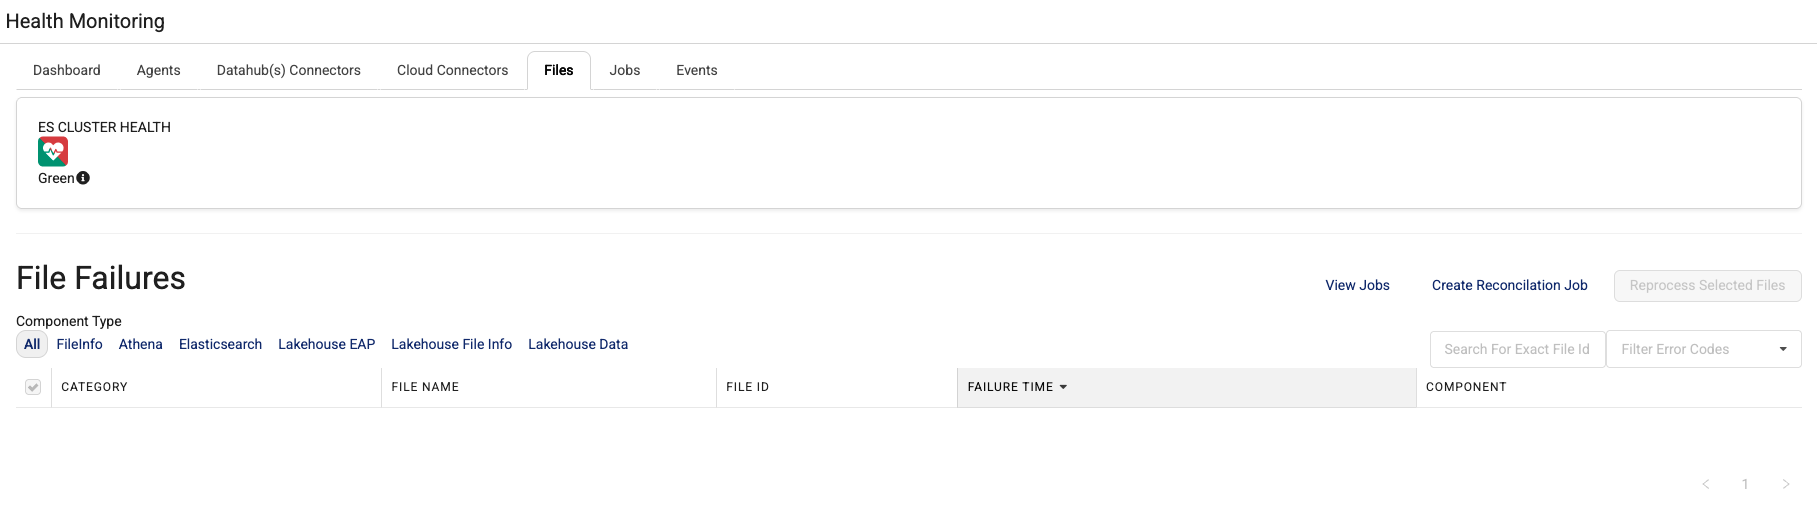
Files Health Dashboard Contents
The Files health dashboard has two sections:
- ES CLUSTER HEALTH
- File Failures
ES Cluster Health
The ES CLUSTER HEALTH section at the top of the Files health monitoring dashboard shows the health status of the OpenSearch cluster that's reported by Amazon CloudWatch.
Three potential statuses are indicated by the following colors:
- Green—indicates that the OpenSearch cluster is healthy and no action is required.
- Yellow—indicates that one or more of the replica shards on the OpenSearch cluster are not allocated to a node.
- Red—indicates that at least one primary shard is not allocated to any node.
Yellow or Red Status?If your ES CLUSTER HEALTH status is yellow or red, please contact your customer success manager (CSM) and/or your AWS IT team.
ES Cluster Storage
To review free and used storage space details for the OpenSearch cluster, you can hover over the information icon next to the ES CLUSTER HEALTH status.
Three potential available storage space amounts are indicated for the ES cluster by the following colors:
- Green—indicates greater than 50% free storage space.
- Yellow—indicates less than 30% to 50% free storage space.
- Red— indicates less than 30% free storage space.
File Failures
The File Failures section shows file event failures only. You can view general information about each file event failure in the list provided, or select a specific file to see the event's error details.
You can search for specific files or sort the list by doing the following:
- To search for a specific file, enter a file name or file ID in the Search For Exact File Id field.
- To filter the list by error code types, select an error code type from the Filter Error Codes drop-down list.
- To sort the list by component type, select one of the following options that are listed below Component Type at the top of the list: All, FileInfo, Athena, or Elasticsearch (now OpenSearch).
File Failures Information
The File Failures list provides the following information:
| Column Name | Description |
|---|---|
| CATEGORY | Data Lake file categories. These categories include TOTAL, RAW, IDS, PROCESSED, and TMP (files or artifacts from a pipeline). |
| FILE NAME | Name of the file. To see the file's path, hove over the file name. To copy the file, select the copy file icon next to the file name. |
| FILE ID | Unique identifier of a file in TDP (primary key). To see the entire file ID, hover over the ID. To copy the file ID, select the copy file icon next to the ID. |
| FAILURE TIME | Date and time of the failed event. |
| COMPONENT | Source of the file discrepancies. |
View a Specific File's Failure Details
To see the details of a specific file failure, select the file name from the File Failures list. Additional rows appear that provide more information about the failure, the error message it returned, and the event's associated logs.
To see the logs for a specific event, select the event. Then, review the event in the RAW EVENT column.
Reprocess Selected Files, Create a Reconciliation Job, or View an Existing Job
At the top right of the Files health monitoring dashboard, you can select any of the following actions:
- View Jobs—opens the Data Reconciliation page, where you can either view your organization's existing jobs or create a new one.
- Create a Reconciliation Job—opens a dialog that provides configuration options for creating a Reconciliation Job.
- Reprocess Selected files—allows you to run a reconciliation job on any specific file failures that you've selected.
NOTEYou can also create a Reconciliation Job from the Data Reconciliation page. For more information, see Monitor and Reprocess Files by Using the Data Reconciliation Page.
Monitor a Reconciliation Job's Status
To monitor a Reconciliation Job's status, go to the Data Reconciliation page by doing the following:
- In the left navigation menu, choose Bulk Actions.
- Choose Data Reconciliation. The Data Reconciliation page appears and displays a list of all your active and inactive Reconciliation Jobs, which includes the following information:
- STATE—shows the job’s status
- NAME—shows the job’s name
- COMPLETION—shows how much of the job has been processed (measured as a percentage)
- STARTED—shows the date and time the job started processing
- COMPLETED—shows the date and time the job completed
- ERRORS—shows any errors that occurred during the job
- COMPONENT—shows the storage type (fileinfoToAthena, fileInfoToEs, or s3ToFileInfo)
- INFO—opens a Bulk Processing Job Details dialog that shows additional information about the job, including the JOB ID, TYPE, and FILE STATUS for each file the job processed.
NOTETo create a new Reconciliation Job from the Data Reconciliation page, select the upper right Create Reconciliation Job button. For more information, see Monitor and Reprocess Files by Using the Data Reconciliation Page.
Documentation Feedback
Do you have questions about our documentation or suggestions for how we can improve it? Start a discussion in TetraConnect Hub. For access, see Access the TetraConnect Hub.
NOTEFeedback isn't part of the official TetraScience product documentation. TetraScience doesn't warrant or make any guarantees about the feedback provided, including its accuracy, relevance, or reliability. All feedback is subject to the terms set forth in the TetraConnect Hub Community Guidelines.
Updated 2 months ago