Superset Monitoring App EAP Release Notes
The following are release notes for the prerelease versions of the Superset Monitoring App. The Superset Monitoring App provides a new Health Monitoring dashboard in the Tetra Data Platform (TDP) user interface to help customers gain an end-to-end understanding of data downtime. The dashboard provides a set of metrics for ingestion failures and latency for on-premises Tetra File-Log Agents and Tetra Data Pipelines.
NOTE
The Superset Monitoring App is available through an early adopter program (EAP) currently and is activated for customers through coordination with TetraScience. For more information, or to activate the app in your environment, contact your customer account leader.
v0.6.0
Release date: 7 March 2025
What's New
TetraScience has released its next version of the Superset Monitoring App, version 0.6.0. This release introduces a new Empower tab for monitoring Tetra Empower Agents. It also replaces the previous Monitoring and Troubleshooting tabs with the following integration-specific tabs: FLA, Pipelines, and Agent Connectivity.
Here are the details for what's new in Superset Monitoring App v0.6.0.
Prerequisites
Superset Monitoring App v0.6.0 requires the following:
- Tetra Data Platform (TDP) v4.1.1 or higher
- Customers must contact their customer success manager (CSM) or account executive to activate the app and the new Health Monitoring Dashboard in the TDP user interface
For Customer-Hosted TDP Environments Only
- The TDP's Transport Layer Security (TLS) certificate must validate the following endpoint:
*.data-apps.tdp-hostname.com - The Domain Name Server (DNS) zone for
tdp-hostname.commust have a CNAME record routing*.data-apps.tdp-hostname.comtotdp-hostname.com
New Functionality
New functionality includes features not previously available in the Tetra Data Platform (TDP) or the Superset Monitoring App.
Tetra Empower Agent Monitoring Tab
A new Empower tab allows customers to monitor ingestion failures and latency for Tetra Empower Agents.
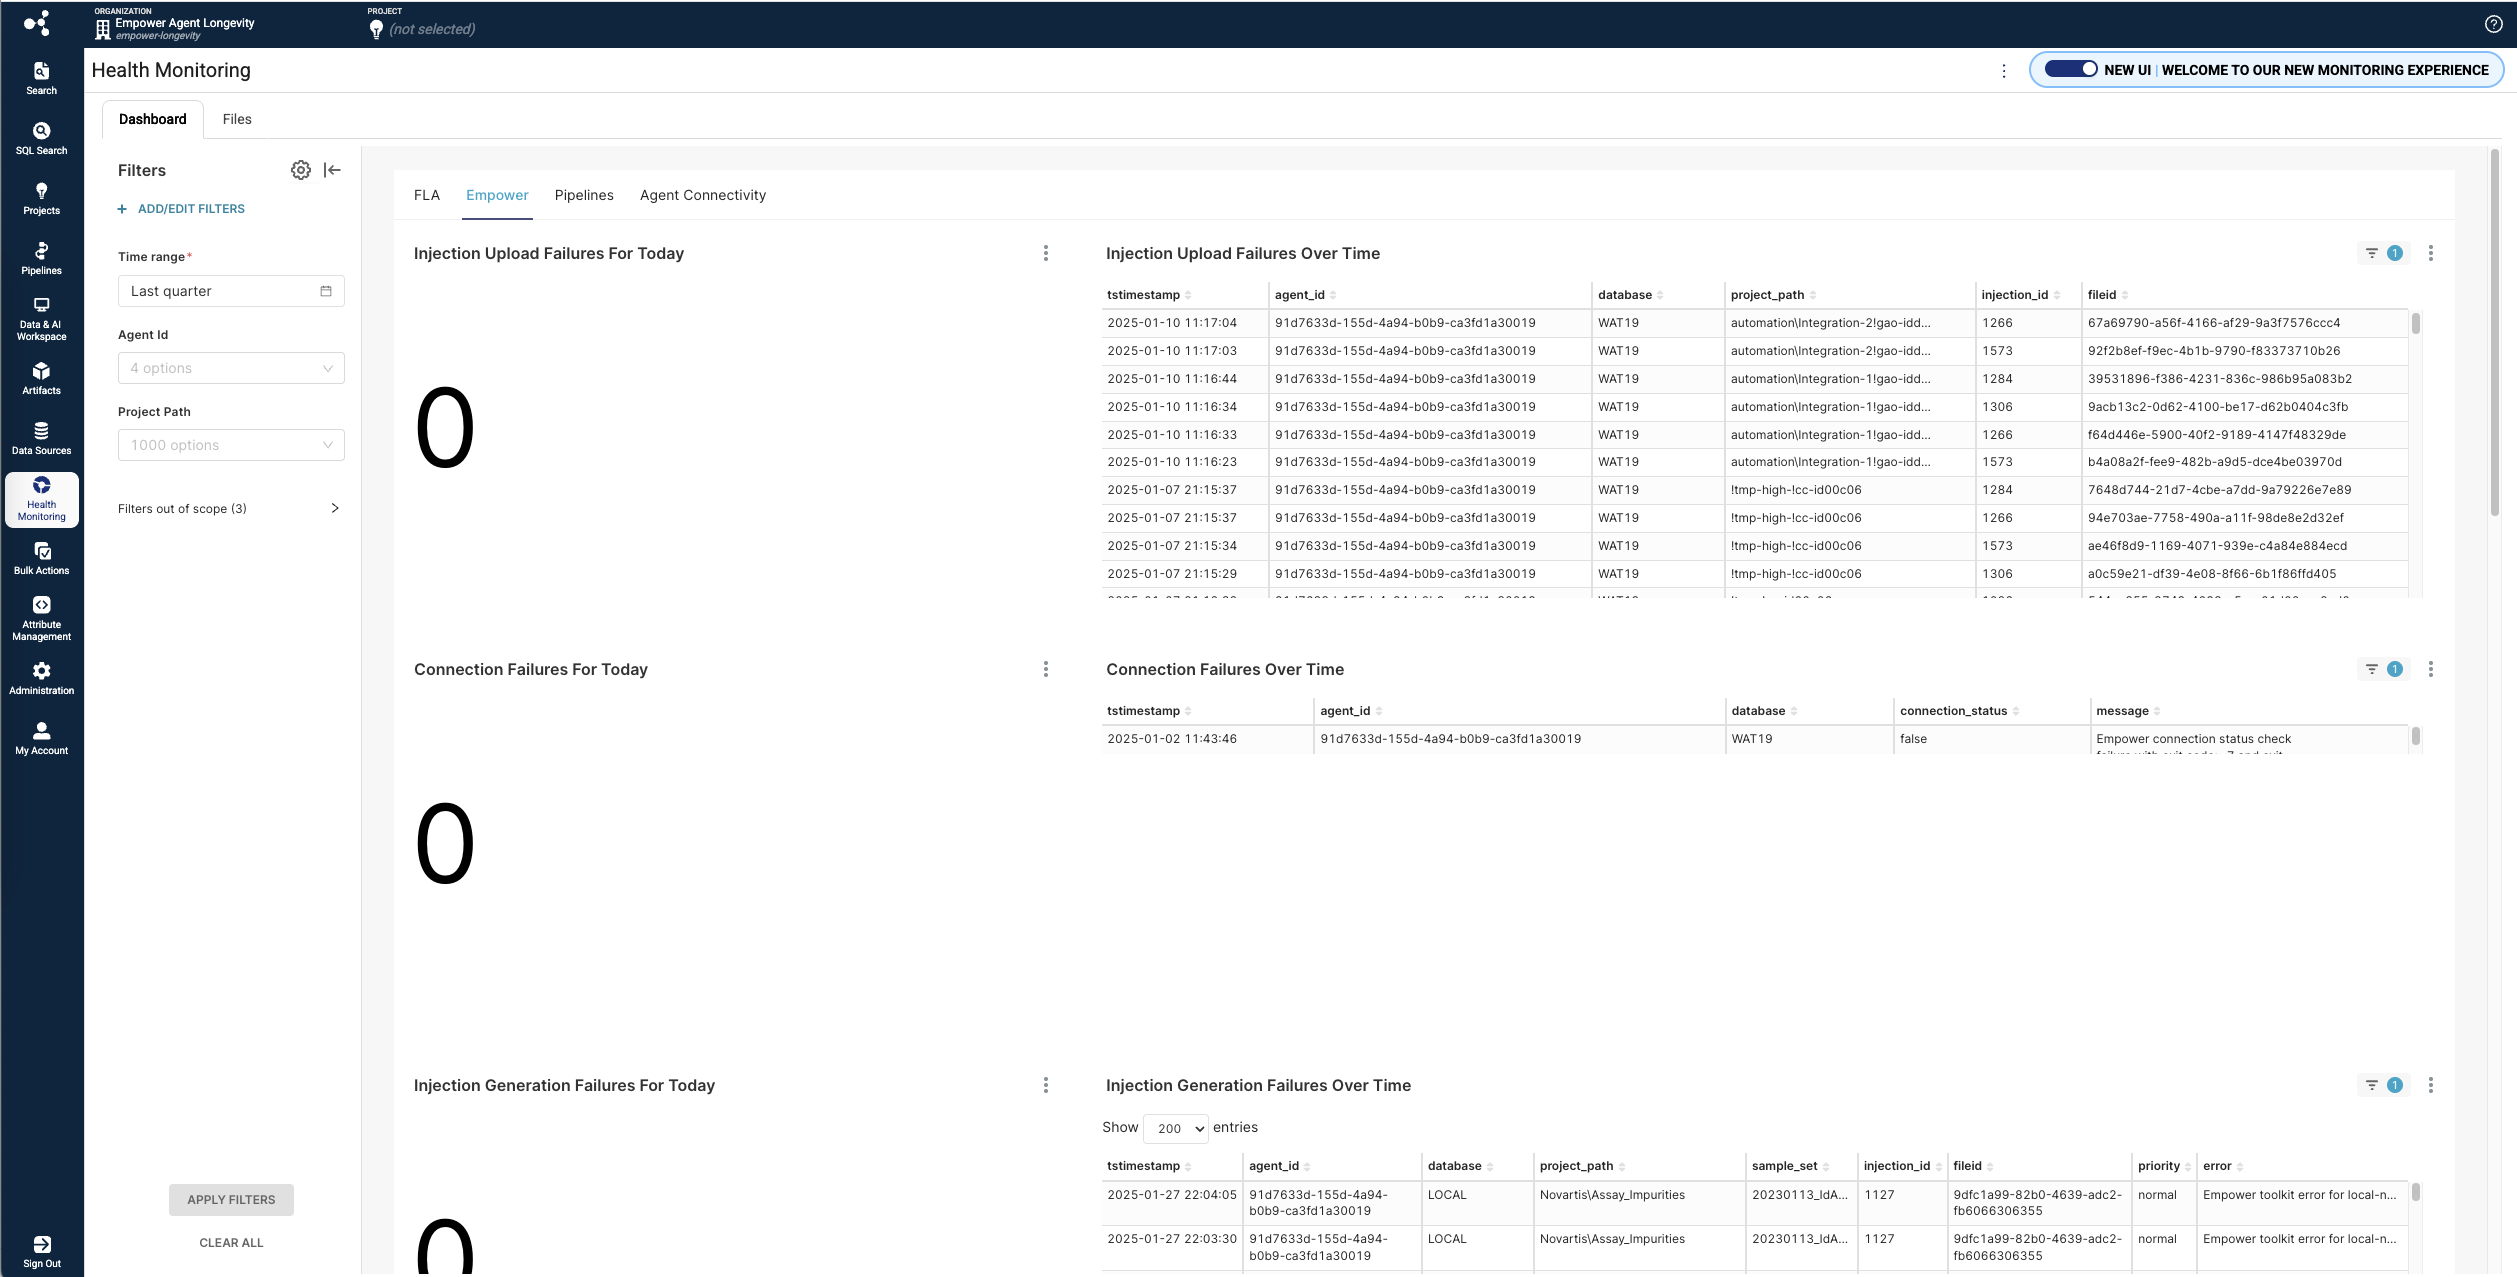
Empower Tab Metrics
The Empower tab includes 14 new metrics:
| Performance Metric | Metric Type | Description |
|---|---|---|
| Injection Upload Failures For Today | KPI | Daily count of failed Empower injection uploads due to generated, but failed injection uploads |
| Injection Upload Failures Over Time | Table | List of failed Empower injection upload attempts within a specified time range, including the project path for each attempt. |
| Connection Failures For Today | KPI | Daily count of failed Empower (Server) Connection Status Checks, if checks are enabled in the Empower Agent |
| Connection Failures Over Time | Table | List of Empower (Server) Connection failed attempts within a specified time range |
| Injection Generation Failures For Today | KPI | Daily count of Empower injections that failed to generate in the Empower Agent |
| Injection Generation Failures Over Time | Table | List of Empower injections that failed to generate within a specified time range, including the project path for each attempt |
| Project Scan Failures For Today | KPI | Daily count of Empower Projects that failed to scan |
| Project Scan Failures Over Time | Table | List of Empower Projects that failed to scan within a specified time range |
| Project Archive Failures For Today | KPI | Daily count of Empower Projects that failed to archive |
| Project Archive Failures Over Time | Table | List of Empower Projects that failed to archive within a specified time range |
| Project Archived For Today | KPI | Daily count of Empower Projects successfully archived |
| Project Archived Over Time | Table | List of Empower Projects that successfully archived within a specified time range |
| Hourly Injection Generation Throughput | Table | Number of injections generated each hour |
| Hourly Injection Generation Latency | Table | Latency calculated on an hourly basis for all high-priority Empower projects |
Enhancements
Integration-Specific Tabs
Along with introducing a new Empower tab, this release replaces the previous Monitoring and Troubleshooting tabs with the following integration-specific tabs:
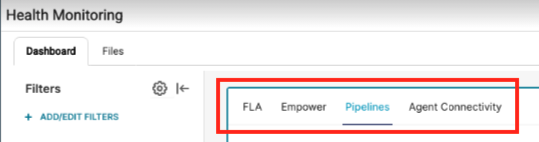
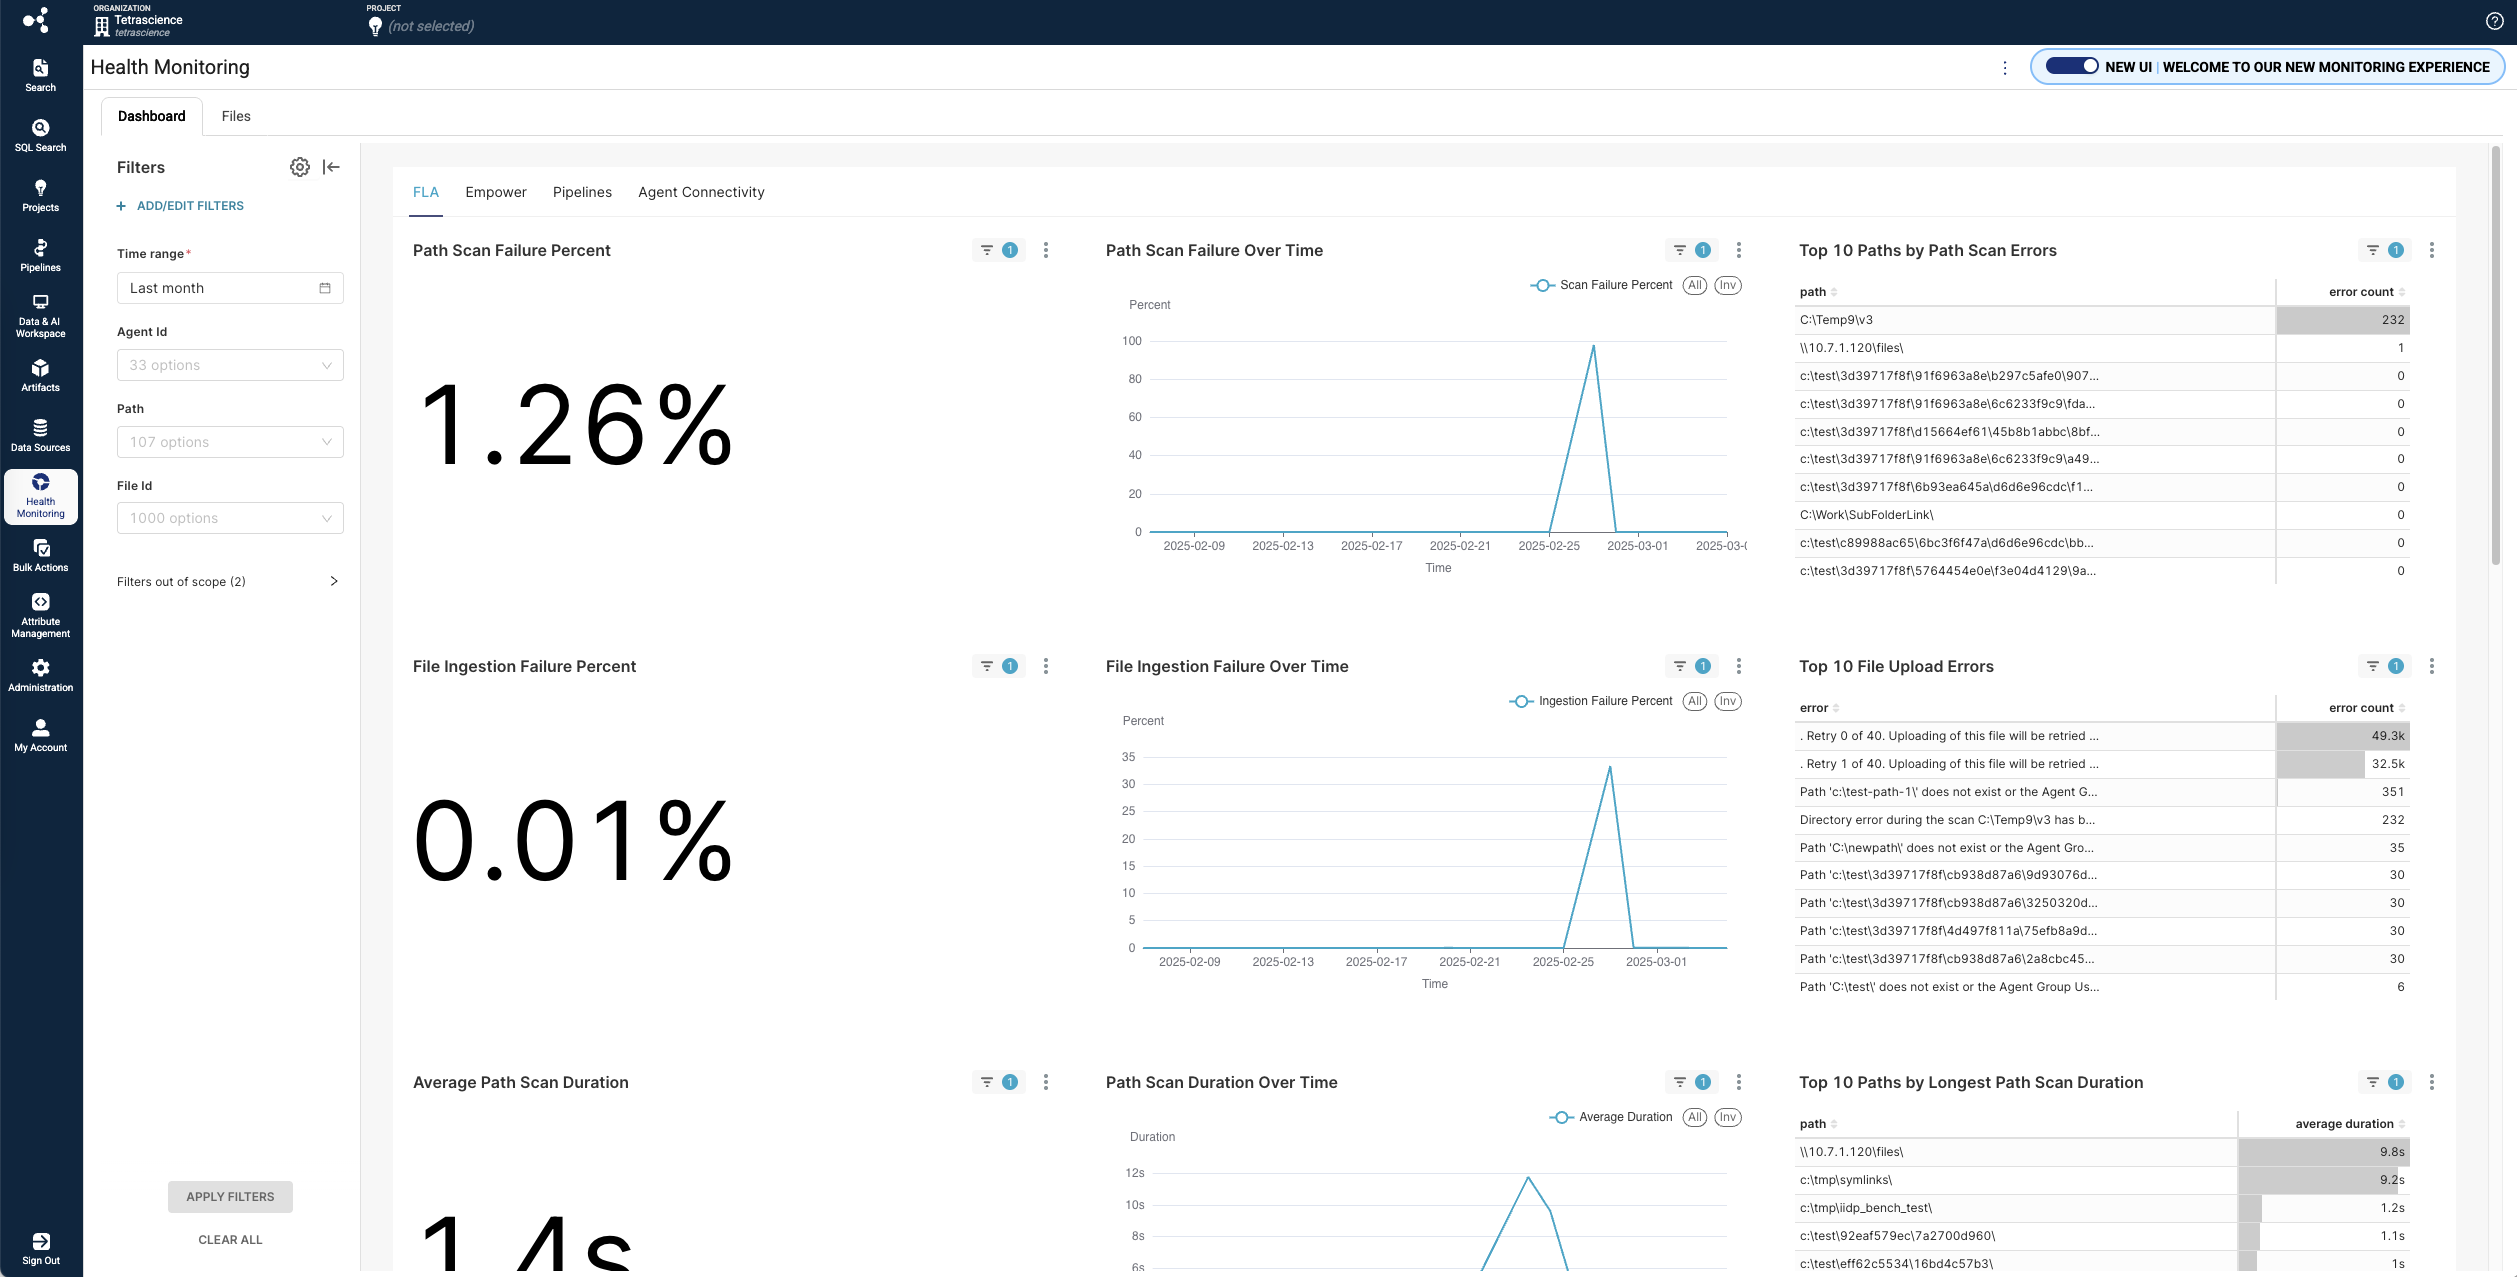
FLA Tab
The FLA tab shows the same metrics for the Tetra File-Log Agent as the previous Monitoring tab.
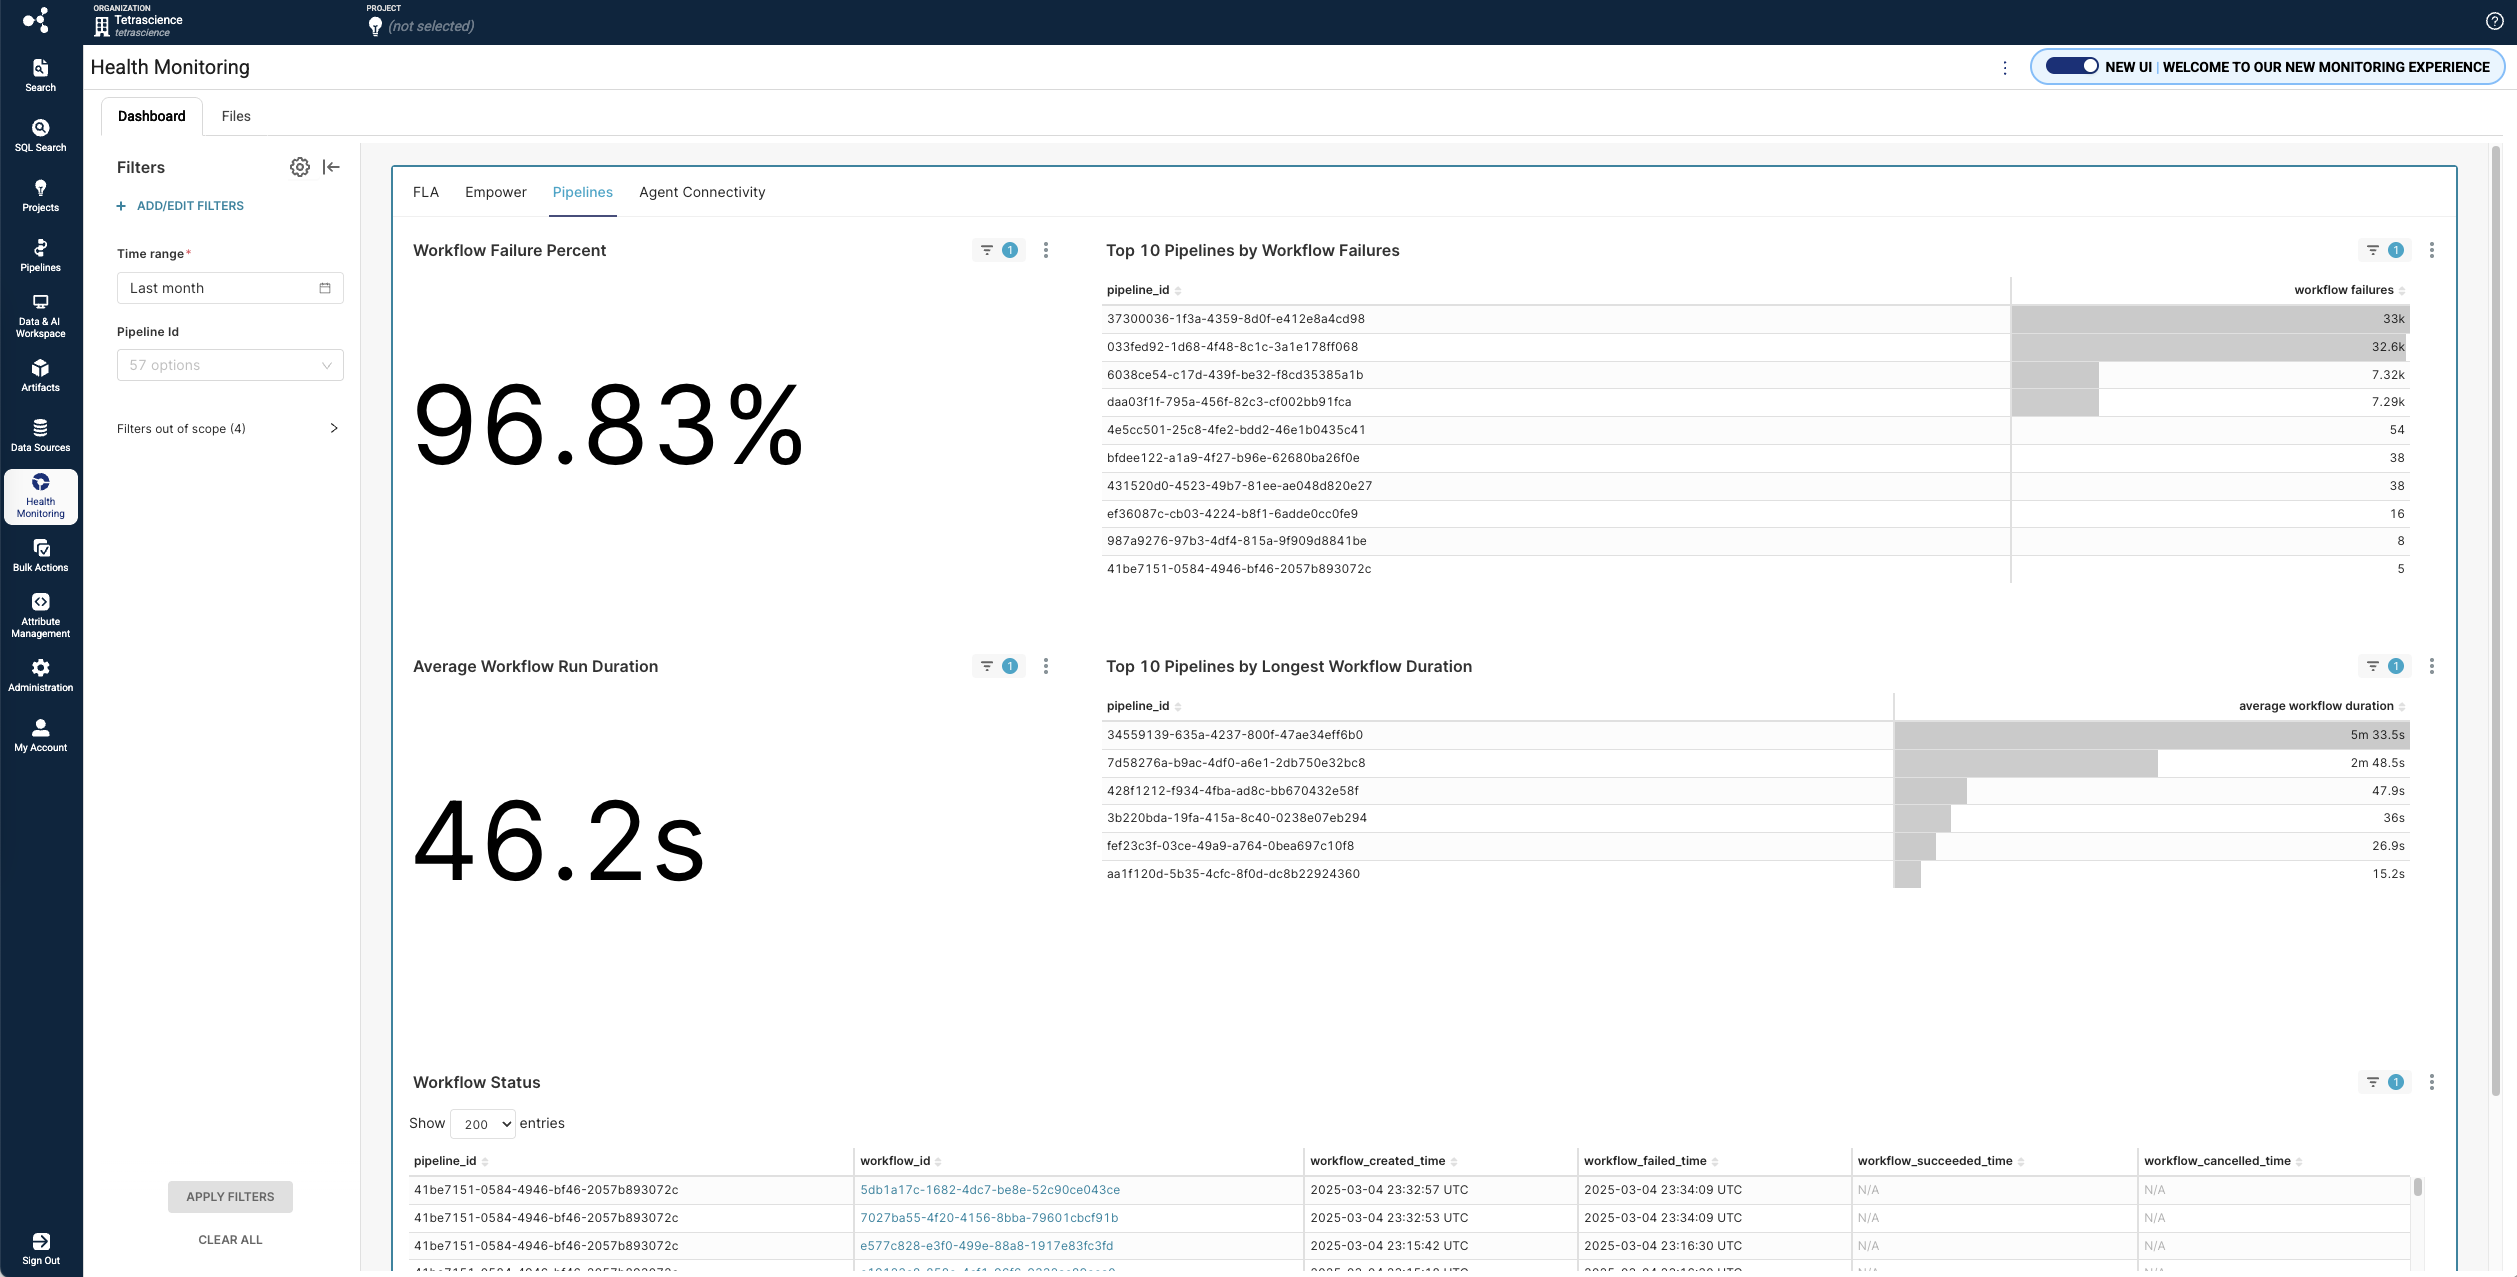
Pipelines Tab
The Pipelines tab shows the same metrics for Tetra Data Pipelines as the previous Monitoring tab.
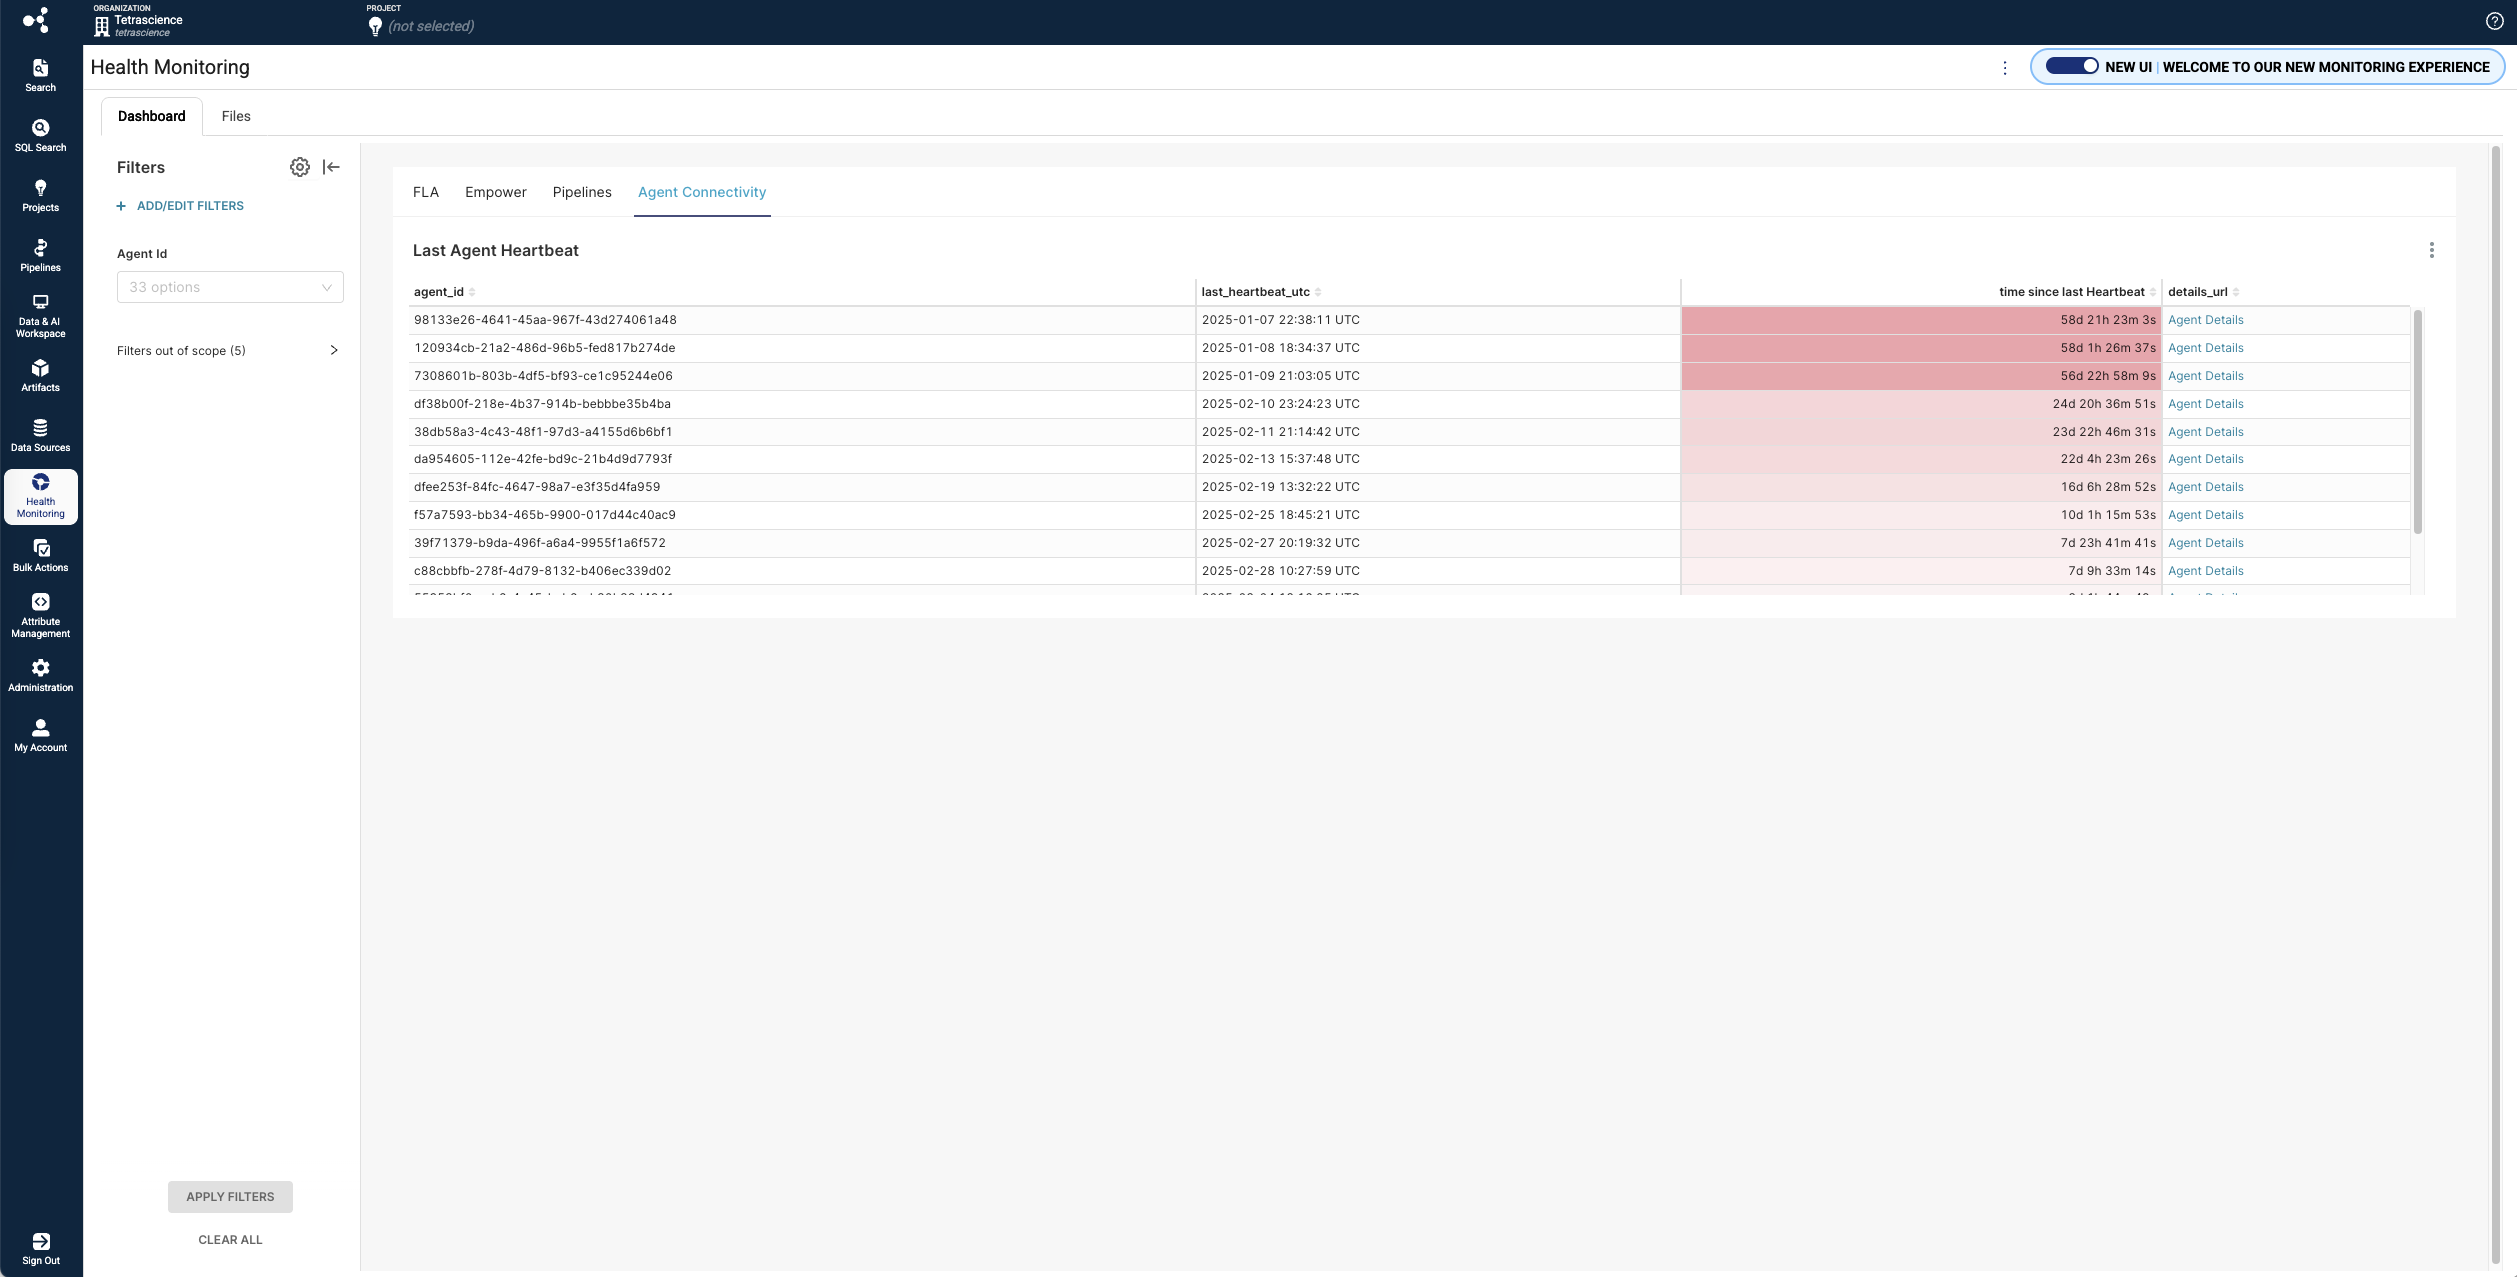
Agent Connectivity Tab
The Agent Connectivity tab shows the same Agent Heartbeat status as the previous Troubleshooting tab.
Limitations
The following are known limitations of Superset Monitoring App v0.6.0:
- Metrics data isn't backfilled when the app is activated, so the available data spans one day in duration only when the new Health Monitoring dashboard first appears in customers' TDP environments.
- If the available data spans one day in duration only (for example, when the new dashboard is first activated) then charts in the new Health Monitoring dashboard will appear empty. If customers hover their cursors over an empty chart, they will see a single data point, which is a summary statistic for that day. Once customers have two-days of data available, then the charts and tables will populate as normal.
- The File Ingestion Journey chart on the Monitoring tab won't show any file search indexing events or other downstream file events if those events occur outside of the Time range filter defined by customers. This behavior occurs because all File Ingestion Journey events are a subset of the original files that were scanned during the specified time range.
- There is a maximum number of table rows available for each of the following troubleshooting metrics:
- Last Agent Heartbeat: 100 row maximum
- File Status: 1,000 row maximum
- Workflow Status: 1,000 row maximum
- Path Status (Latest Scan): 1,000 row maximum
- The AgentID in Filters shows all available Agents that may or may not be specific to the Agent Tab.
Bug Fixes
There are no bug fixes in this release.
Known and Possible Issues
The following are known issues for Superset Monitoring App v0.6.0:
- The Superset Monitoring App sometimes fails to load and displays a 500 internal server error. To resolve the issue, customers should log out of the TDP, close their web browser, and then reopen the browser and sign back in to the TDP. A fix for this issue is in development and testing and is scheduled for a future release.
- After selecting Enter fullscreen on a graph, the graph can sometimes fail to render and an error appears. To resolve the issue, navigate back to the dashboard and re-enter the fullscreen view. (Updated on 20 February 2025)
Upgrade Considerations
To activate the Superset Monitoring App in the Tetra Data and AI Workspace, please contact your customer success manager (CSM) or account executive.
To access the new Health Monitoring dashboard, open the legacy Health Monitoring page in the TDP. Then, select the upper right New UI | WELCOME TO OUR NEW MONITORING EXPERIENCE toggle.
For more information, see Superset Monitoring App in the TetraConnect Hub. To get access, see Access the TetraConnect Hub.
v0.5.1
Release date: 12 February 2025
What's New
TetraScience has released its next version of the Superset Monitoring App, version 0.5.1. This release introduces a new Current Time Range type and fixes an issue that prevented the app from working in environments with self-signed certificates.
Here are the details for what's new in Superset Monitoring App v0.5.1.
Prerequisites
Superset Monitoring App v0.5.1 requires the following:
- Tetra Data Platform (TDP) v4.1.1 or higher
- Customers must contact their customer success manager (CSM) or account executive to activate the app and the new Health Monitoring Dashboard in the TDP user interface
For Customer-Hosted TDP Environments Only
- The TDP's Transport Layer Security (TLS) certificate must validate the following endpoint:
*.data-apps.tdp-hostname.com - The Domain Name Server (DNS) zone for
tdp-hostname.commust have a CNAME record routing*.data-apps.tdp-hostname.comtotdp-hostname.com
Enhancements
New Current Time Range Type
The Time Range dropdown now includes a new Current time range type. When Current is selected along with one of the required time ranges, such as day, week, or month,
then the displayed date range now includes the current day in the selected time range.
Upgrade to Apache Superset v 4.1.1
The graphing software that the Superset Monitoring App uses was upgraded to Apache Superset v4.1.1 from v4.0.0.
For more information about the changes included in the Apache Superset release, see the Superset v4.1.0 ChangeLog and the Superset v.4.1.1 ChangeLog.
Limitations
The following are known limitations of Superset Monitoring App v0.5.1:
- Metrics data isn't backfilled when the app is activated, so the available data spans one day in duration only when the new Health Monitoring dashboard first appears in customers' TDP environments.
- If the available data spans one day in duration only (for example, when the new dashboard is first activated) then charts in the new Health Monitoring dashboard will appear empty. If customers hover their cursors over an empty chart, they will see a single data point, which is a summary statistic for that day. Once customers have two-days of data available, then the charts and tables will populate as normal.
- The File Ingestion Journey chart on the Monitoring tab won't show any file search indexing events or other downstream file events if those events occur outside of the Time range filter defined by customers. This behavior occurs because all File Ingestion Journey events are a subset of the original files that were scanned during the specified time range.
- There is a maximum number of table rows available for each of the following troubleshooting metrics:
- Last Agent Heartbeat: 100 row maximum
- File Status: 1,000 row maximum
- Workflow Status: 1,000 row maximum
- Path Status (Latest Scan): 1,000 row maximum
Bug Fixes
The following issues were fixed in the Superset Monitoring App v0.5.1:
- The Superset Monitoring App is now compatible with environments that have self-signed certificates.
Known and Possible Issues
(Last updated: 20 February 2025)
The following are known issues for Superset Monitoring App v0.5.1:
- The Superset Monitoring App sometimes fails to load and displays a 500 internal server error. To resolve the issue, customers should log out of the TDP, close their web browser, and then reopen the browser and sign back in to the TDP. A fix for this issue is in development and testing and is scheduled for a future release.
- After selecting Enter fullscreen on a graph, the graph can sometimes fail to render and an error appears. To resolve the issue, navigate back to the dashboard and re-enter the fullscreen view. (Updated on 20 February 2025)
Upgrade Considerations
To activate the Superset Monitoring App in the Tetra Data and AI Workspace, please contact your customer success manager (CSM) or account executive.
To access the new Health Monitoring dashboard, open the legacy Health Monitoring page in the TDP. Then, select the upper right New UI | WELCOME TO OUR NEW MONITORING EXPERIENCE toggle.
For more information, see Superset Monitoring App in the TetraConnect Hub. To get access, see Access the TetraConnect Hub.
v0.5.0
Release date: 15 October 2024
What's New
TetraScience has released its first version of the Superset Monitoring Embedded Data App, version 0.5.0, as part of an EAP. The Superset Monitoring App provides a new Health Monitoring dashboard in the Tetra Data Platform (TDP) user interface to help customers gain an end-to-end understanding of data downtime. The dashboard provides a set of metrics for ingestion failures and latency for on-premises Tetra File-Log Agents and Tetra Data Pipelines.
Customers can access the new Health Monitoring dashboard in the TDP after it's activated by doing the following:
- Open the legacy Health Monitoring page.
- Select the upper right New UI | WELCOME TO OUR NEW MONITORING EXPERIENCE toggle.
Here are the details for what's new in Superset Monitoring App v0.5.0.
Prerequisites
Superset Monitoring App v0.5.0 requires the following:
- Tetra Data Platform (TDP) v4.1.1 or higher
- Customers must contact their customer success manager (CSM) or account executive to activate the app and the new Health Monitoring Dashboard in the TDP UI
For Customer-Hosted TDP Environments Only
- The TDP's Transport Layer Security (TLS) certificate must validate the following endpoint:
*.data-apps.tdp-hostname.com - The Domain Name Server (DNS) zone for
tdp-hostname.commust have a CNAME record routing*.data-apps.tdp-hostname.comtotdp-hostname.com
New Functionality
New functionality includes features not previously available in the Tetra Data Platform (TDP) or the Superset Monitoring App.
New Health Monitoring Dashboard UI
A single, interactive Health Monitoring dashboard provides performance trending analytics for Tetra File-Log Agents and Tetra Data Pipelines in the following areas.
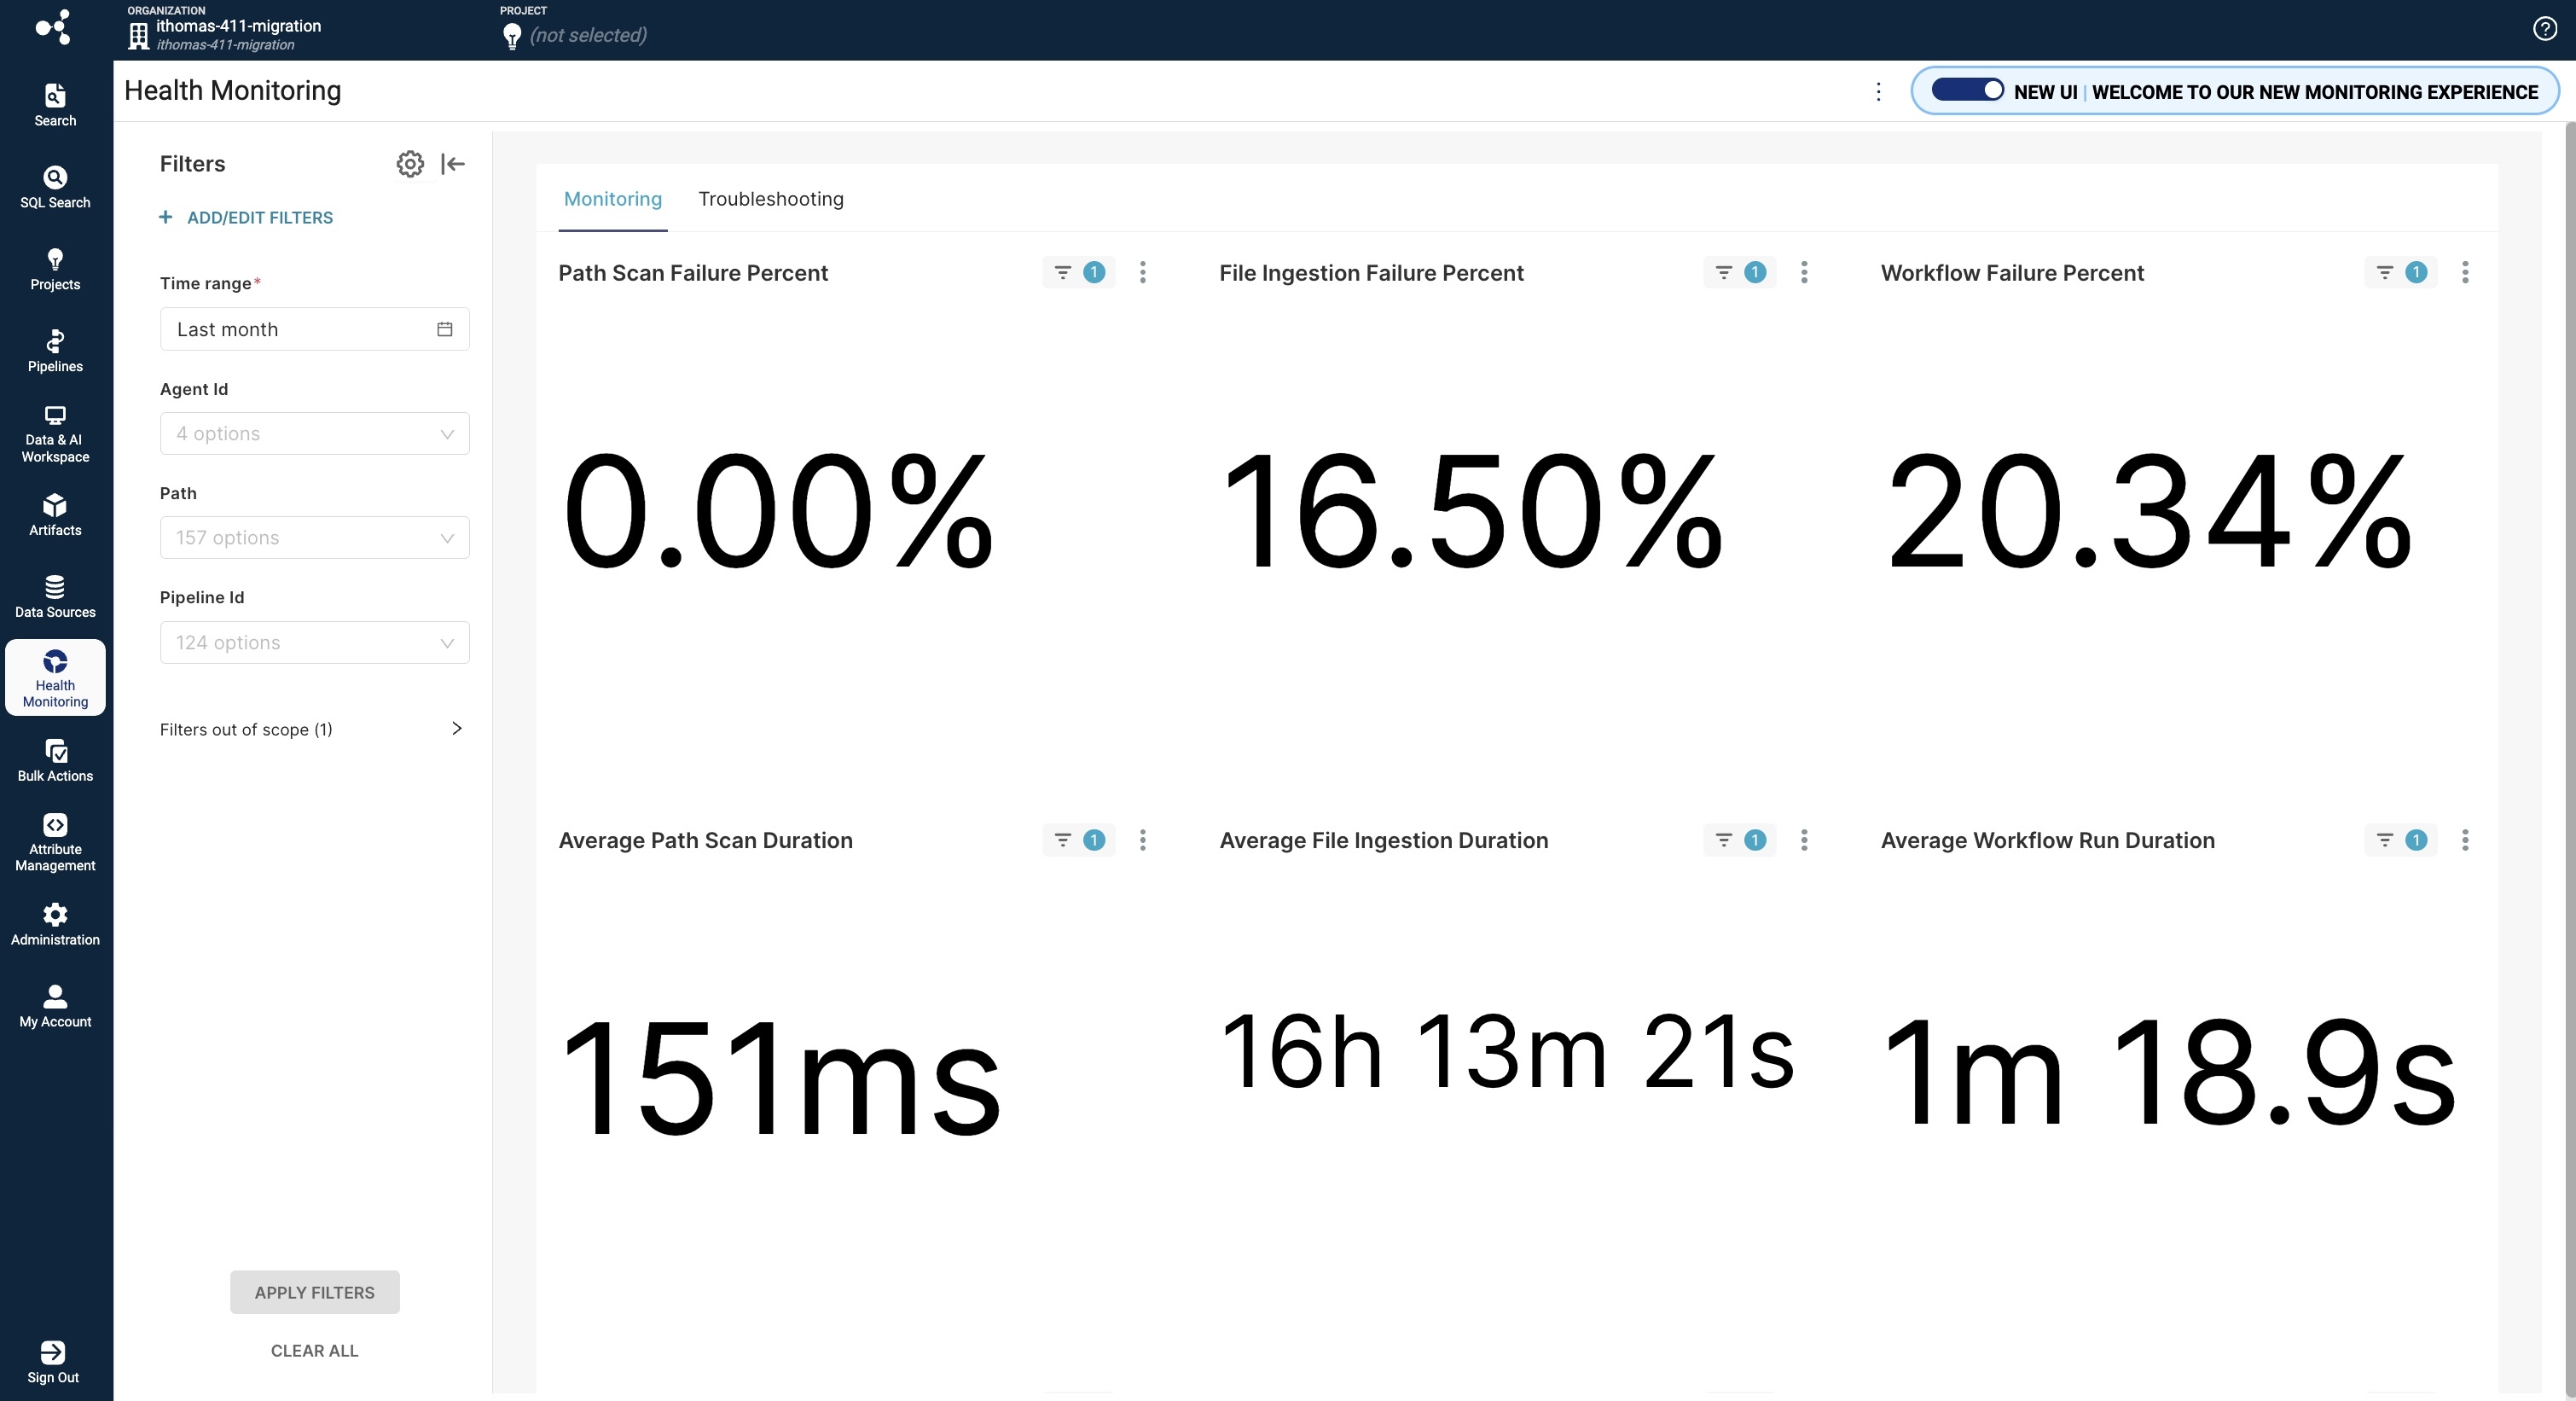
Monitoring
The dashboard's Monitoring tab shows key performance indicators (KPIs), historical trends (charts), and the top 10 TDP entities where data downtime is highest (tables).
Monitoring Performance Metrics
| Performance Metric | Metric Type | Description |
|---|---|---|
| Path Scan Failure Percent | KPI | Percent of scans failed from all started path scans |
| File Ingestion Failure Percent | KPI | Percent of files that failed to appear in File Search from all started path scans |
| Workflow Failure Percent | KPI | Percent of pipeline workflows that failed from all of the workflows that ran |
| Average Path Scan Duration | KPI | Average time it took for all succeeded and failed path scans to complete |
| Average File Ingestion Duration | KPI | Average time it took for files to be scanned and then become available through search in the TDP |
| Workflow Run Duration | KPI | Average time it took for pipelines to run each successful workflow |
| Path Scan Failure Over Time | Chart | Percentage of path scans that failed from all path scans that started over a specific time range |
| File Ingestion Failure Over Time | Chart | Percentage of scanned files that failed to appear in search over a specific time range |
| Workflow Failure Over Time | Chart | Percentage of started pipeline workflows that failed over a specific time range |
| Path Scan Duration Over Time | Chart | Average time it took for all succeeded and failed path scans to complete over a specific time range |
| File Ingestion Duration Over Time | Chart | Average time it took for scanned files to appear in search over a specific time range |
| Workflow Run Duration Over Time | Chart | Average time it took for pipelines to run each successful workflow over a specific time range |
| File Ingestion Journey | Chart | The current number of files in each stage of the file ingestion journey |
| Top 10 Paths by Path Scan Errors | Table | The 10 scan paths that had the highest File Scan error rate |
| Top 10 File Upload Errors | Table | The 10 scan paths that had the highest File Upload error rate |
| Top 10 Pipelines by Workflow Failures | Table | The 10 pipelines that had the highest workflow failure rate |
| Top 10 Paths by Longest Path Scan Duration | Table | The 10 scan paths that took the longest to complete each scan |
| Top 10 Files by Longest File Ingestion Duration | Table | The 10 files that took the longest to become available through search in the TDP after being scanned |
| Top 10 Pipelines by Longest Workflow Duration | Table | The 10 pipelines that had the longest average workflow runtime duration |
Monitoring Filters
Customers can apply the following filters to metrics on the Monitoring tab:
- Time range: Defines a specific time range for each metric
- AgentID: Indicates a specific Tetra File-Log Agent by its ID
- Path: Indicates a specific scan path
- PipelineID: Indicates a specific Tetra Data Pipeline by its ID
Troubleshooting
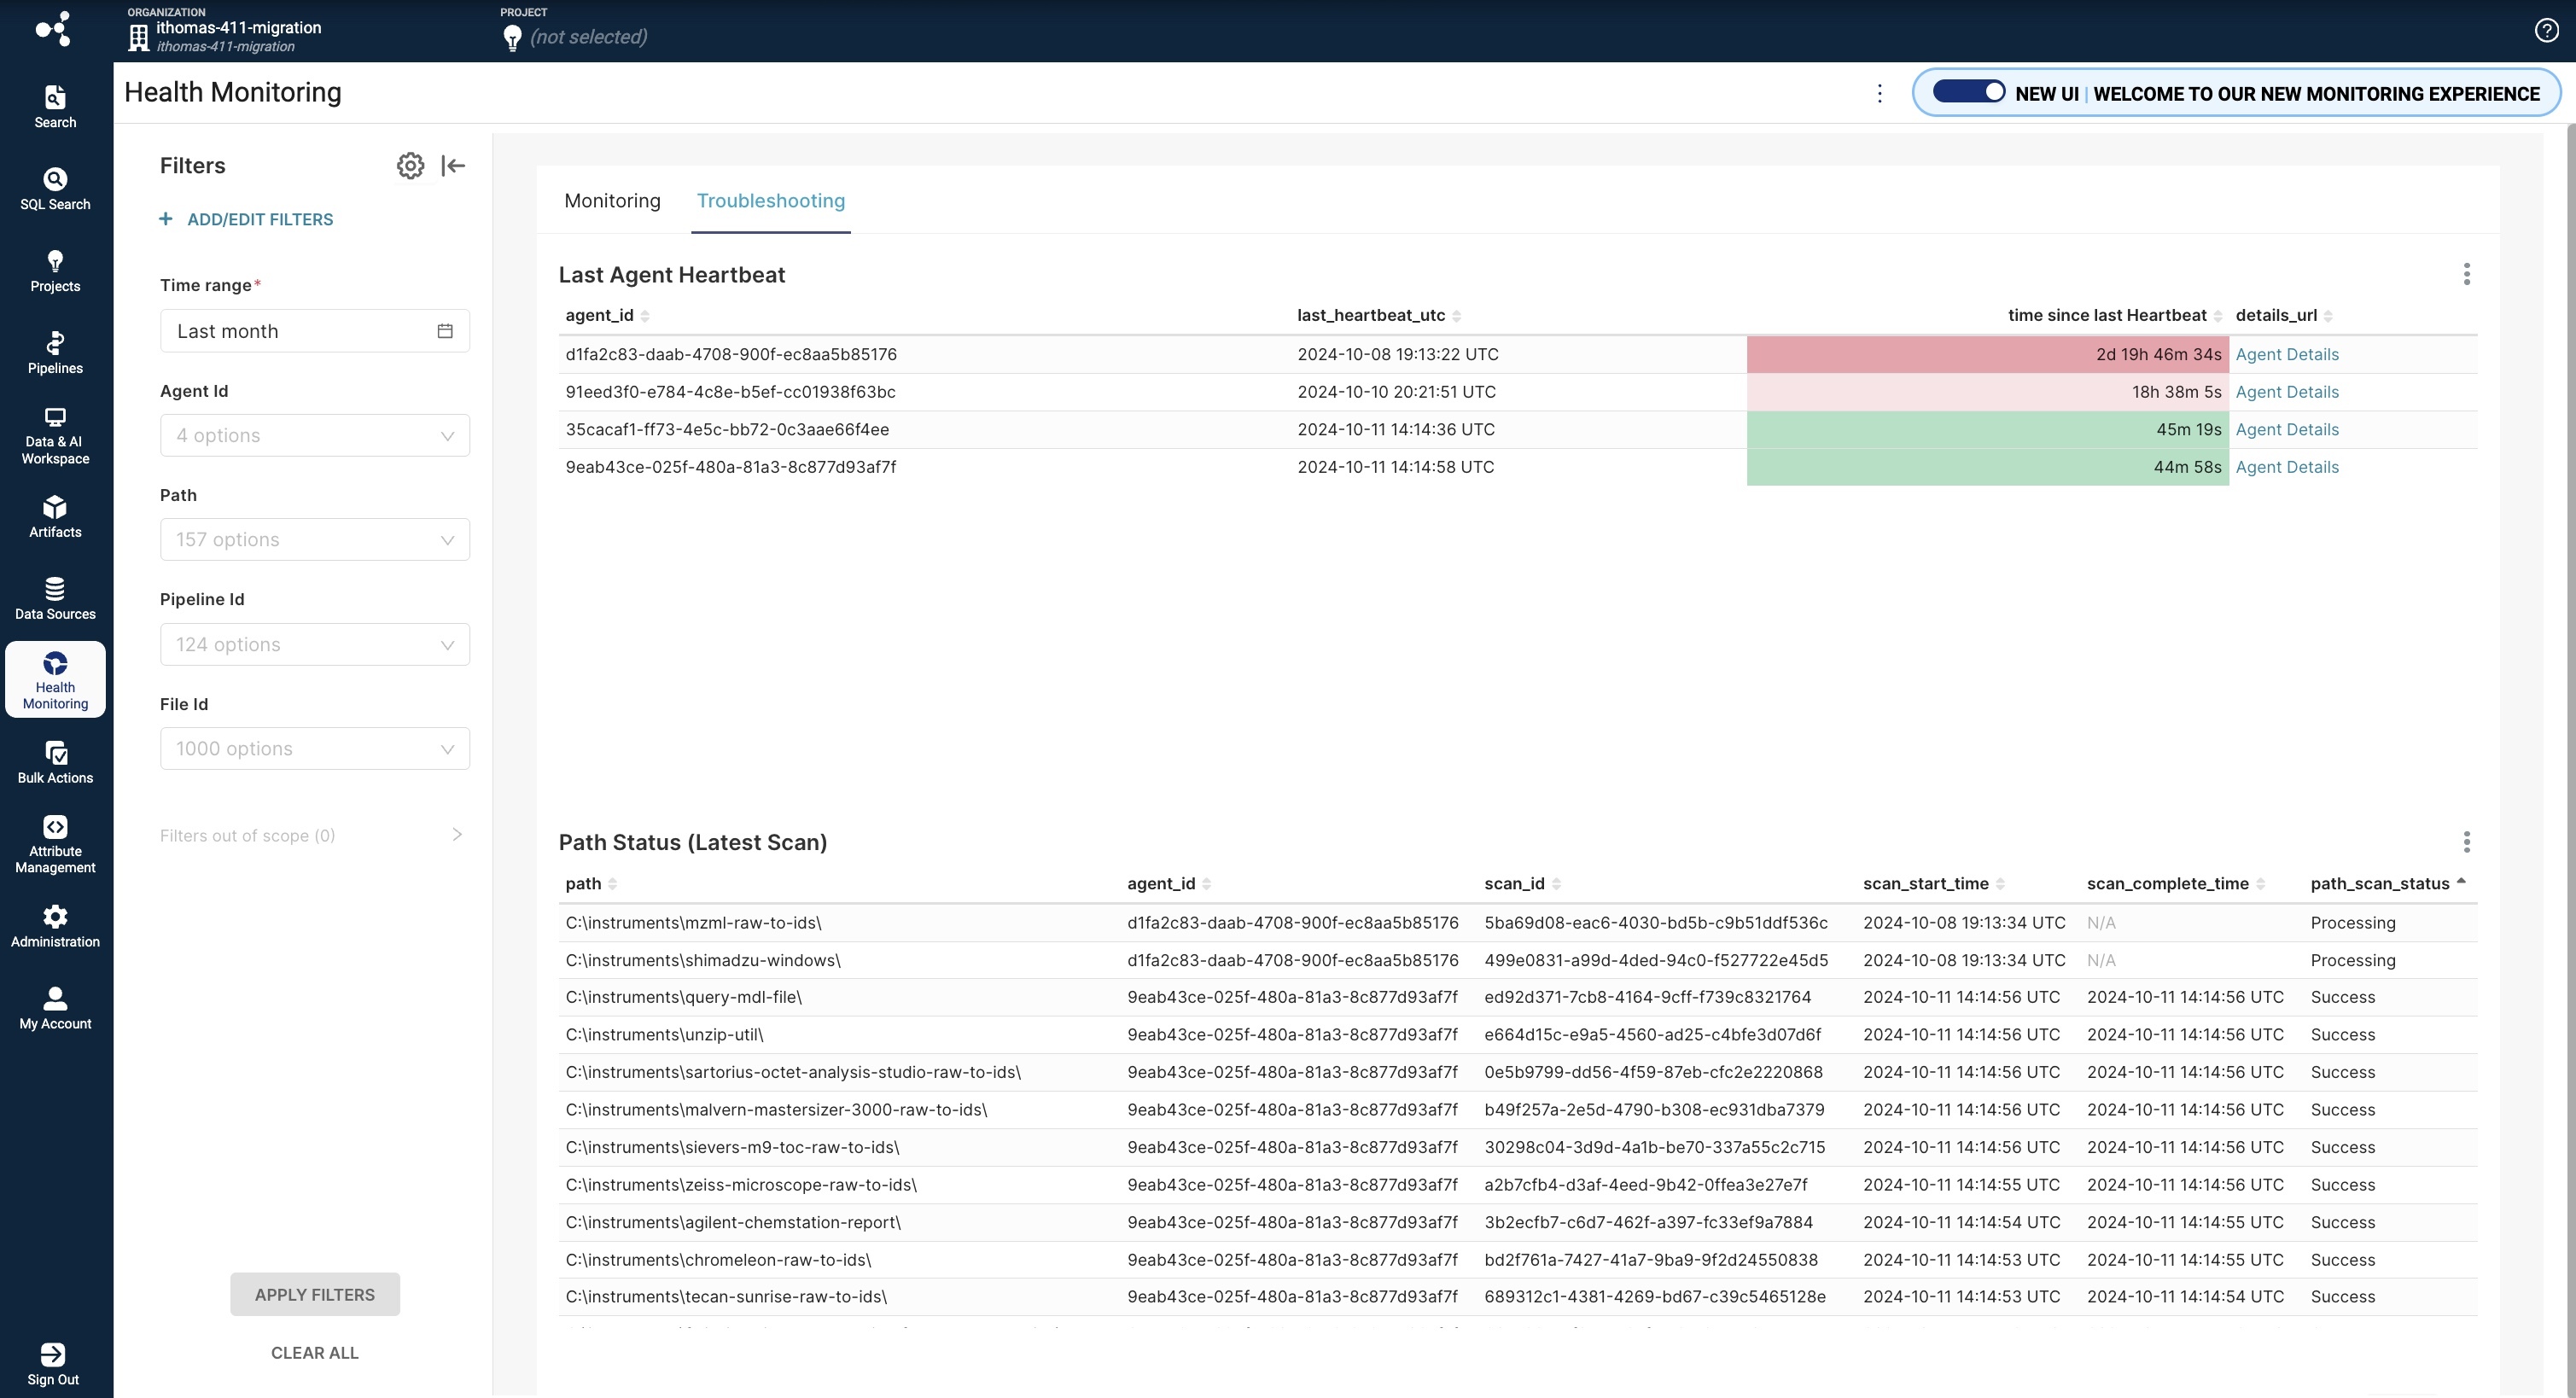
The dashboard's Troubleshooting tab shows metrics as tables to help with troubleshooting data downtime issues.
Troubleshooting Metrics
| Performance Metric | Metric Type | Description |
|---|---|---|
| Last Agent Heartbeat | Table | Shows when the TDP received the last heartbeat signal from each agent |
| Path Status (Latest Scan) | Table | Shows the scan time and status for the latest scan on each scan path |
| File Status | Table | Shows key events in the file ingestion journey for each ingested file |
| Workflow Status | Table | Shows the workflow status for each pipeline |
Troubleshooting Filters
Customers can apply the following filters to metrics on the Troubleshooting tab:
- Time range: Defines a specific time range for each metric
- AgentID: Indicates a specific Tetra File-Log Agent by its ID
- Path: Indicates a specific scan path
- PipelineID: Indicates a specific Tetra Data Pipeline by its ID
- FileID: Indicates a specific file by its ID
Limitations
The following are known limitations of Superset Monitoring App v0.5.0:
- Metrics data isn't backfilled when the app is activated, so the available data spans one day in duration only when the new Health Monitoring dashboard first appears in customers' TDP environments.
- If the available data spans one day in duration only (for example, when the new dashboard is first activated) then charts in the new Health Monitoring dashboard will appear empty. If customers hover their cursors over an empty chart, they will see a single data point, which is a summary statistic for that day. Once customers have two-days of data available, then the charts and tables will populate as normal.
- The File Ingestion Journey chart on the Monitoring tab won't show any file search indexing events or other downstream file events if those events occur outside of the Time range filter defined by customers. This behavior occurs because all File Ingestion Journey events are a subset of the original files that were scanned during the specified time range.
- There is a maximum number of table rows available for each of the following troubleshooting metrics:
- Last Agent Heartbeat: 100 row maximum
- File Status: 1,000 row maximum
- Workflow Status: 1,000 row maximum
- Path Status (Latest Scan): 1,000 row maximum
Known and Possible Issues
(Last updated: 20 February 2025)
The following are known issues for Superset Monitoring App v0.5.0:
- The Superset Monitoring App sometimes fails to load and displays a 500 internal server error. To resolve the issue, customers should log out of the TDP, close their web browser, and then reopen the browser and sign back in to the TDP. A fix for this issue is in development and testing and is scheduled for a future release. (Updated on 23 December 2024)
- In KPI graphs that display a single summary number, the last character is sometimes partially obscured. To make all characters fully visible, resize the window. (Updated on 20 February 2025)
- After selecting Enter fullscreen on a graph, the graph can sometimes fail to render and an error appears. To resolve the issue, navigate back to the dashboard and re-enter the fullscreen view. (Updated on 20 February 2025)
- This release will not work in environments with self-signed certificates. (Updated on 6 February 2024)
Upgrade Considerations
To activate the Superset Monitoring App in the Tetra Data and AI Workspace, please contact your customer success manager (CSM) or account executive.
To access the new Health Monitoring dashboard, open the legacy Health Monitoring page in the TDP. Then, select the upper right New UI | WELCOME TO OUR NEW MONITORING EXPERIENCE toggle.
For more information, see Superset Monitoring App in the TetraConnect Hub. To get access, see Access the TetraConnect Hub.
Other Release Notes
To view other release notes for Tetra Data Apps, see Tetra Data Apps Release Notes.
Updated 3 months ago