Monitor Platform Health
The Tetra Data Platform (TDP) Health Monitoring Dashboard provides an end-to-end snapshot of your components' health and performance across your entire TDP ecosystem.
The Health Monitoring Dashboard provides performance and health status visualizations for each of these TDP components and event types:
NOTEThe new Health Monitoring App displays detailed observability metrics for Tetra Integrations to help customers better track and troubleshoot data downtime (for example, data ingestion failures or high latency). You can access the new observability metrics to build your own dashboards in a third-party analytics tool by connecting to the new dashboard’s SQL tables. To help you proactively monitor your data sources, you can also activate the optional Alert Management page and configure email notifications for offline integrations.
View the Health Monitoring Dashboard
To view the Health Monitoring Dashboard, do the following:
- Sign in to the TDP as a user with an Administrator role.
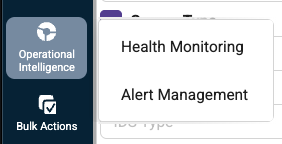
- In the left navigation menu, choose Operational Intelligence (menu option displays as Health Monitoring in TDP v4.4.0 and earlier). Then, select Health Monitoring.
The Health Monitoring dashboard appears with the Dashboard tab selected by default, which displays an end-to-end snapshot of your components' health for your entire TDP ecosystem.
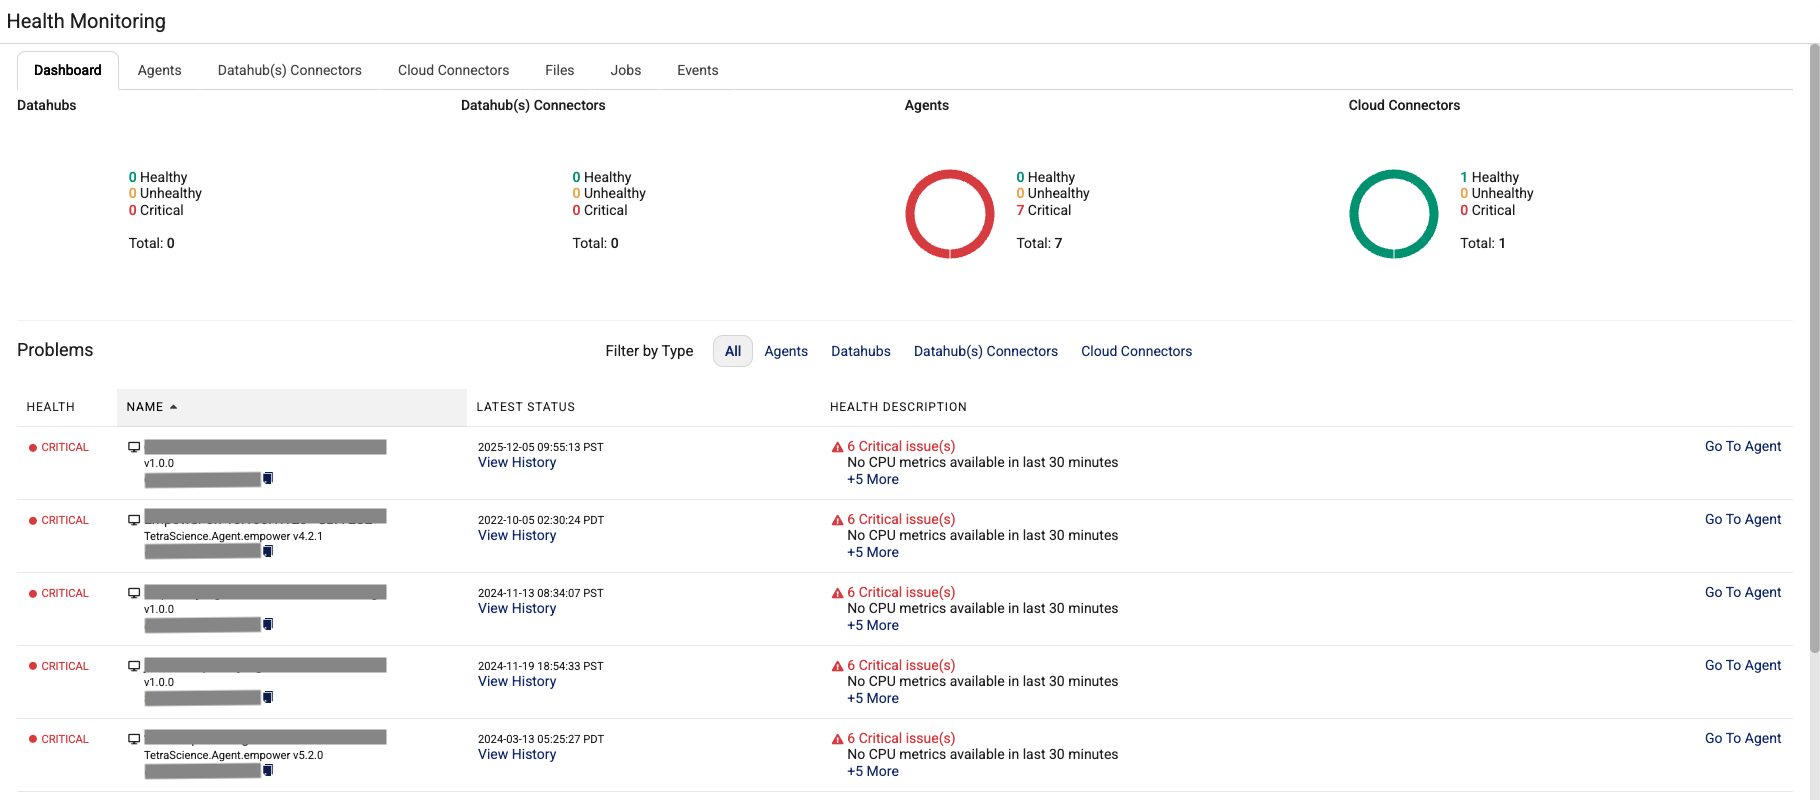
Component Health Status
The top section of the Dashboard tab indicates the health status of each TDP component. The status is indicated by a statistical visualization of how many instances of a component are in a Healthy, Unhealthy, or Critical state. Each visualization also provides a file Total for each component type.

Statistical Visualization Example
Possible Health Statuses for Components
| Possible States | Definition | Example |
|---|---|---|
| Healthy | Indicates that the component is operating optimally within specified parameters. What is considered optimal differs by component. | A healthy connector makes a connection within three attempts. |
| Unhealthy | Indicates that the component is not operating optimally, but has not failed. What is considered optimal differs by component. | An unhealthy datahub has a memory usage value that is greater than 80% but less than, or equal to 90%, for the past five contiguous minutes. |
| Critical | Indicates that the component has failed or is well outside the specified parameters. Similar to the Healthy and Unhealthy states, the exact elements that contribute to the Critical state differs by component. | If the percentage of used disk space for a Tetra Agent is greater than 90%, then that component is in a critical state. |
Problems
The bottom section of the Dashboard tab on the Health Monitoring Dashboard displays a detailed list of component instances with Critical issues.

NOTETo review information for components that aren't in a Critical state, you must view the specific dashboard for each TDP component.
Filtering Problems
You can filter any listed problems by the following filter types:
- All
- Agents
- Data Hubs
- Data Hub Connectors
- Cloud Connectors.
Each component listed in the Problems section of the Health Monitoring Dashboard includes the following information:
| Field | Description |
|---|---|
| Health | Health status.
|
| Name | Name (and representative icon) of the component instance that is currently in the Critical state. To sort the list of components by name, click the arrow next to Name at the top of the column. You can sort items alphabetically, or in reverse order. To view additional details about the component, you can hover over the name. The information that displays is customized based on the component type. To copy the unique ID for the component instance, select the copy file icon. |
| Latest Status | When the latest status (Date/Time format) was assigned, and whether its currently Active or Disabled. To review a component's status history, select the View History link below the status. |
| Health Description | Explains why the component has been assigned a Criticalstatus (shown by issues and/or warnings). By default, one issue is shown only. If there is more than one issue, then a link displays (for example, +1 More) indicating that there are additional issues to review. |
| Link | Provides a link that you can select to review the configuration details for the component. |
View Component Status History
If available, you can click View History from the LATEST STATUS column to review a component's list of status changes. TDP polls each component every five minutes. If a change of status occurs during the five minute polling interval, then an entry is added to the component's status history.
Available Component Status Historical Data
The following component status historical data is available for each component type:
- Time: In date/time format, indicating when a status change occurred
- Change: Shows the status change
- Errors: Displays any error(s) that caused the component status to change
- Warnings: Displays any warning(s) that caused component status to change
View Cloud Connector History Example
The following image shows the history of a selected cloud connector in the Dashboard tab of the Health Monitoring page:

View History example
Documentation Feedback
Do you have questions about our documentation or suggestions for how we can improve it? Start a discussion in TetraConnect Hub. For access, see Access the TetraConnect Hub.
NOTEFeedback isn't part of the official TetraScience product documentation. TetraScience doesn't warrant or make any guarantees about the feedback provided, including its accuracy, relevance, or reliability. All feedback is subject to the terms set forth in the TetraConnect Hub Community Guidelines.
Updated 2 months ago